

TL;DR
Updated on: Aug 8 2025
There are plenty of online resources covering the basics of GDB, so I won’t include that here. This note is a work in progress, updated as needed to address debugging various types of binaries. This note focuses on advanced debugging techniques, supplemented with demo code available on GitHub. It will be updated as needed to address different types of binaries.
GDB | Init
.gdbinit
Personal configuration file .gdbinit under ~ which defines GDB behaviors:
source /home/Axura/pwn/pwndbg/gdbinit.py
source /home/Axura/pwn/Pwngdb/pwngdb.py
source /home/Axura/pwn/Pwngdb/angelheap/gdbinit.py
source /home/Axura/pwn/splitmind/gdbinit.py

# --- General configuration
# Don't skip repeat value when use telescope
set telescope-skip-repeating-val off

# Display CPU flags
set show-flags on

# Display the Link Register (LR) in AArch64
set show-retaddr-reg on

# Set backtrace lines 4
set context-backtrace-lines 4

# Don't stop when catching a SIGALARM signal, and simply prints it
handle SIGALRM nostop print nopass

# set detach-on-fork off
# set follow-fork-mode parent

# set sourcecode directory
# directory /usr/src/glibc/glibc-2.27/malloc

set debuginfod enabled on
set DEBUGINFOD_URLS=https://debuginfod.archlinux.org

set environment LD_LIBRARY_PATH=/opt/glibc-2.41/lib:/usr/lib
set debug-file-directory /opt/glibc-2.41/lib:/usr/lib/debug
set solib-search-path /opt/glibc-2.41/lib:/usr/lib
#directory /opt/glibc-2.41

# Hide source code section
#set context-sections regs disasm stack backtrace


# --- Splitmind from https://github.com/jerdna-regeiz/splitmind
python
import gdb
try:
    import splitmind
except ImportError:
    gdb.write("[split] Splitmind not found – skipping\n")
    raise SystemExit

def _build_layout():
    (splitmind.Mind()
      .tell_splitter(show_titles=True)
      .tell_splitter(set_title="Main")
      .right(display="backtrace", size="15%")
      .above(of="main", display="disasm", size="80%", banner="top")
      .show("code", on="disasm", banner="none")
	  .right(cmd='tty; tail -f /dev/null', size="55%", clearing=False)
      .tell_splitter(set_title='I/O')
      .above(display="stack", size="80%")
      .above(display="legend", size="20")
      .show("regs", on="legend")
      .below(of="backtrace", cmd="ipython", size="35%")
    ).build(nobanner=True)

    # pwndbg context tweaks
    gdb.execute("set context-code-lines 30")
    gdb.execute("set context-source-code-lines 30")
    gdb.execute("set context-stack-lines 12")
    gdb.execute("set context-sections regs args code disasm stack backtrace")

class SplitCmd(gdb.Command):
    """split  – activate the Splitmind pane layout."""
    def __init__(self):
        super().__init__("split", gdb.COMMAND_USER)
    def invoke(self, arg, from_tty):
        _build_layout()

class SplitAlias(gdb.Command):
    """sp  – short alias for split."""
    def __init__(self):
        super().__init__("sp", gdb.COMMAND_USER)
    def invoke(self, arg, from_tty):
        gdb.execute("split", from_tty)

SplitCmd()
SplitAlias()
end


# --- Define `bbase`: PIE-aware breakpoint
define bbase
    b *$rebase($arg0)
end

document bbase
Set a breakpoint at a PIE-adjusted address.

Usage:
    bbase <offset>

Example:
    bbase 0x1234   - Breaks at (base + 0x1234)

Note:
    - Requires a $rebase function to compute the correct address.
    - Especially useful when debugging PIE binaries where fixed offsets are needed.
end


# --- Display memory in quadwords
# Usage: dq <address> [count]
# e.g.: dq 0x601000 16
define dq
    if $argc == 1
        x /8gx $arg0
    end
    if $argc == 2
        x /$arg1gx $arg0
    end
end

# --- Display memory in doublewords (32-bit)
define dd
    if $argc == 1
        x /16wx $arg0
    end
    if $argc == 2
        x /$arg1wx $arg0
    end
end

# --- Display memory in words  (16-bit)
define dw
    if $argc == 1
        x /32hx $arg0
    end
    if $argc == 2
        x /$arg1hx $arg0
    end
end

# --- Display memory in bytes (8-bit)
define db
    if $argc == 1
        x /64bx $arg0
    end
    if $argc == 2
        x /$arg1bx $arg0
    end
end


# --- Inject Strings & Bytes Into GDB Running Process
define inject
    if $argc == 0
        printf "Usage: inject <python-bytestr>\n"
        printf "Example: inject 'b\"ABC\\x00\\xff\"'\n"
    else
        set $pid = $_pid
        shell python3 -c "import sys; sys.stdout.buffer.write($arg0)" > /proc/$pid/fd/0
        printf "Injected bytes into /proc/%d/fd/0\n", $pid
    end
end

document inject
Inject arbitrary bytes into the debuggee's stdin using /proc/<pid>/fd/0.

Usage:
    inject 'b"ABC\\x00\\xff"'

Note:
    - Make sure the process is paused at a point where it is waiting for input (e.g., fgets/read).
    - This uses python3 to write binary-safe payloads.

Example:
    (gdb) inject 'b"A"*64 + b"\\xef\\xbe\\xad\\xde"'
end


# --- Enable Pwngdb from https://github.com/scwuaptx/Pwngdb
define hook-run
python
import angelheap
angelheap.init_angelheap()
end
end


# --- decomp2dbg
source /home/Axura/.d2d.pyGDB | Start
Exec Template
#!/bin/sh

gdb -q \
    -ex "" \
    -ex "" \
    -ex "" \
./binarySet PATH
Customize LD_LIBRARY_PATH:
gdb -q \
	  --args ./ld-2.35.so \
    --library-path ./libc-2.35.so.6 \
./binaryOther Sets
Config arguments for runtime:
set args <args>Display set arguments:
show argsConfig path for binary:
path dirDisplay set path:
show pathsConfig environment variables:
set environment <var=value>GDB | Config
LD & Glibc
set exec-wrapper ./ld-linux-x86-64.so.2 --library-path ./
# set environment LD_LIBRARY_PATH=./Configuration
Check current configurations:
gdb --configurationExample:
$ gdb --configuration

This GDB was configured as follows:
   configure --host=x86_64-pc-linux-gnu --target=x86_64-pc-linux-gnu
             --with-auto-load-dir=$debugdir:$datadir/auto-load
             --with-auto-load-safe-path=$debugdir:$datadir/auto-load
             --with-expat
             --with-gdb-datadir=/usr/share/gdb (relocatable)
             --with-jit-reader-dir=/usr/lib/gdb (relocatable)
             --without-libunwind-ia64
             --with-lzma
             --without-babeltrace
             --without-intel-pt
             --with-xxhash
             --with-python=/usr (relocatable)
             --with-python-libdir=/usr/lib (relocatable)
             --with-debuginfod
             --with-curses
             --with-guile
             --without-amd-dbgapi
             --enable-source-highlight
             --enable-threading
             --enable-tui
             --with-system-readline
             --with-separate-debug-dir=/usr/lib/debug (relocatable)
--with-system-gdbinit=/etc/gdb/gdbinitVerbose Exception
set exception-verbose on
set exception-debugger onPtrace Priv
If we try to attach a detached child process running gdb attach <child_pid>, GDB probably will fail, with output:
attach: No such file or directory.
Attaching to process 6655
ptrace: Operation not permitted.It could because the process is running as a different user. And GDB lacks sufficient privileges (e.g., requires sudo or ptrace capabilities).
On modern Linux systems, ptrace can be restricted by security mechanisms such as YAMA (e.g., ptrace_scope setting). If we check the file:
$ cat /proc/sys/kernel/yama/ptrace_scope
1A value of 1 or higher might restrict attaching to processes. We can temporarily change it to 0 for debugging:
$ sudo sysctl -w kernel.yama.ptrace_scope=0
kernel.yama.ptrace_scope = 0

$ cat /proc/sys/kernel/yama/ptrace_scope
0Permanent Change:
echo "kernel.yama.ptrace_scope=0" | sudo tee -a /etc/sysctl.conf
echo "kernel.yama.ptrace_scope=0" | sudo tee -a /etc/sysctl.d/99-ptrace.conf
sudo sysctl --systemDisable Skipping Stack View
By default, Pwndbg skips same data in stack view for simplicity, for example:
pwndbg> stack 0x20
00:0000│ rsi rsp 0x7fffffffd670 ◂— 0x6161616161616161 ('aaaaaaaa')
... ↓            7 skipped
08:0040│-010     0x7fffffffd6b0 —▸ 0x4c17d0 —▸ 0x401780 ◂— endbr64
09:0048│-008     0x7fffffffd6b8 ◂— 0xaddb33bf2cb27700
0a:0050│ rbp     0x7fffffffd6c0 —▸ 0x7fffffffd6d0 ◂— 1
0b:0058│+008 0x7fffffffd6c8 —▸ 0x40186b ◂— endbr64But sometimes we will need a full-scale view to debug. To stop skipping repeated values in the telescope view, use the following command:
pwndbg> set telescope-skip-repeating-val off
Set whether to skip repeating values of the telescope command to 'off'.Make the Change Permanent: Edit .gdbinit file, adding the following line:
set telescope-skip-repeating-val offGDB | Debug Symbols
show debug-file-directory
set debug-file-directory /path/to/lib/.debug/
info share GDB | Attach
Run the binary by specifying LD_LIBRARY_PATH:
LD_LIBRARY_PATH=/path/to/custom/libc /path/to/ld --library-path /path/to/libc ./binaryCTRL Z to background the process, Get PID, and attach it to GDB:
ps aux | grep <binary_file_name>
gdb -p <PID>GDB | X
X | Format
x /[n][f][u] <address>/: Format specifiers[n]: Number of units to display[f]: Formatx: Hexadecimald: Decimalu: Unsigned Decimalo: Octalt: Binarya: Addressi: Instruction (disassembly)c: Characters: String
[u]: Unit sizeb: Byteh: Hafwordw: Wordg: Giant word
X | Examples
Codes: link
Examine a Global Variable
pwndbg> x &global_var
0x555555558018 <global_var>: 0x12345678If any of [n], [f], or [u] are omitted, GDB uses defaults:
- Default format:
x(hexadecimal) - Default unit size:
w(word) - Default count:
1
Inspect Multiple Words
pwndbg> x/4x &global_var
0x555555558018 <global_var>:    0x0000000012345678      0x47202c6f6c6c6548
0x555555558028 <global_str+8>: 0x4048f5c300214244 0x0000000000000000Examine a String
Display strings until hitting null terminator:
pwndbg> x/s &global_str
0x555555558020 <global_str>: "Hello, GDB!"Examine a Float
pwndbg> x/f &global_float
0x55555555802c <global_float>: 3.1400001Disassemble Instructions
Disassembles 10 instructions starting from the main function:
pwndbg> x/10i main
   0x555555555139 <main>:       push   rbp
   0x55555555513a <main+1>:     mov    rbp,rsp
   0x55555555513d <main+4>:     sub    rsp,0x10
=> 0x555555555141 <main+8>:     mov    DWORD PTR [rbp-0x4],0xdeadbeef
   0x555555555148 <main+15>:    lea    rax,[rip+0xeb5]        # 0x555555556004
   0x55555555514f <main+22>:    mov    rdi,rax
   0x555555555152 <main+25>:    call   0x555555555030 <puts@plt>
   0x555555555157 <main+30>:    mov    eax,0x0
   0x55555555515c <main+35>:    leave
0x55555555515d <main+36>: retExamine a Local Variable
After setting a breakpoint after test_function, display the value of local_var in hexadecimal format, which is on the stack and only exists while test_function() is executing
pwndbg> x/x &local_var
0x7fffffffd7fc: 0xdeadbeefDisplay a local string:
pwndbg> x/s &local_str
0x7fffffffd80b: "Local String"Display a dynamically set variable after malloc:
pwndbg> x/x dynamic_var
0x5555555596b0: 0x00000000feedfaceExplore Stack Memory
Display 16 words of memory starting at the current stack pointer ($rsp):
pwndbg> x/16x $rsp
0x7fffffffd7f0: 0x00000018      0x00000000      0x00000000      0xdeadbeef
0x7fffffffd800: 0xff000000      0x00000000      0x00000000      0x00000000
0x7fffffffd810: 0x2f2f2f2f      0x2f2f2f2f      0xdc7b3300      0x491ba903
0x7fffffffd820: 0xffffd830 0x00007fff 0x555552d2 0x00005555Examine Memory Byte by Byte
Display the first 8 bytes of global_var in hexadecimal format, one byte at a time:
pwndbg> x/8b &global_var
0x555555558038 <global_var>: 0x78 0x56 0x34 0x12 0x00 0x00 0x00 0x00Examine Memory as Characters
Display global_str character by character, including the null terminator:
pwndbg> x/12c &global_str
0x555555558040 <global_str>:    72 'H'  101 'e' 108 'l' 108 'l' 111 'o' 44 ','  32 ' '  71 'G'
0x555555558048 <global_str+8>: 68 'D' 66 'B' 33 '!' 0 '\000'Examine Memory in Binary Format
Display global_var in binary format, showing its bit-level representation:
pwndbg> x/4t &global_var
0x555555558038 <global_var>:    0000000000000000000000000000000000010010001101000101011001111000        0100011100100000001011000110111101101100011011000110010101001000
0x555555558048 <global_str+8>: 0100000001001000111101011100001100000000001000010100001001000100 0000000000000000000000000000000000000000000000000000000000000000- Displays
global_varin binary format, showing its bit-level representation.
Explore Memory Addresses
Display the memory address of global_var.
pwndbg> x/a &global_var
0x555555558038 <global_var>: 0x12345678GDB | Set
Code: link
Set a breakpoint before return and compare modified value with the original ones.
Set | Syntax
set {<type>} <address> = <value><type>: Specifies the data type of the memory content to modify (e.g.,int,char,float).<address>: The memory address to modify.<value>: The new value to set at the specified address.
Set | Memory Address
The syntax for modifying memory is:
pwndbg> set {int} &global_var = 0xdeadbeef

pwndbg> x &global_var
0x555555558038 <global_var>: 0xdeadbeefSet | Registers
Inspect registers with command info registers or regs.
pwndbg> regs
*RAX  0
...

pwndbg> set $rax = 0x1234

pwndbg> regs
*RAX  0x1234
...Set | String
Set a global string to a new value:
pwndbg> x &global_str
0x555555558040 <global_str>:    0x6c6c6548

pwndbg> x/s &global_str
0x555555558040 <global_str>:    "Hello, GDB!"

pwndbg> set global_str[0] = 'X'

pwndbg> x/s &global_str
0x555555558040 <global_str>: "Xello, GDB!"Set | Variable
set variable <variable_name> = <value>GDB | Break
Conditional Breakpoints
break <file>:<line> if <condition>or
break <address> if <condition>GDB | Watch
Basic Usage
Monitor value change on variable <myVar>:
watch <myVar>
watch (<myVar> > <value>)Monitor data inside an address:
watch *<address>Monitor a pointer value:
wathc *<ptr>Monitor 4 bytes of read/write:
watch *(int *)<address>Monitor 8 bytes of read/write:
watch *(long long int*)<address>Read watch:
rwatch <expression>Access watch (read/write):
awatch <expression>Example
Code: link
Set a read watchpoint to break when global_var is accessed:
pwndbg> rwatch global_var
Hardware read watchpoint 1: global_varSet an access watchpoint to break when global_var is read or written:
pwndbg> awatch global_var
Hardware access (read/write) watchpoint 2: global_varRun and inspect breakpoints:
pwndbg> r

pwndbg> i b
Num     Type            Disp Enb Address            What
1       read watchpoint keep y                      global_var
        breakpoint already hit 1 time
2       acc watchpoint  keep y                      global_var
breakpoint already hit 1 timeView initial value of the global variable when the first breakpoints hit:
pwndbg> p global_var
$1 = 0Continue the program as breakpoints are hit, inspect the values of the global variable for example:
pwndbg> i b
Num     Type            Disp Enb Address            What
1       read watchpoint keep y                      global_var
        breakpoint already hit 2 times
2       acc watchpoint  keep y                      global_var
        breakpoint already hit 2 times

pwndbg> p global_var
$7 = 10GDB | Catch
Catch a breakpoint at specific function call:
catch <func>

# example
catch exec
catch forkCatch a syscall and set a breakpoint:
catch syscall <num|name>

# example
catch syscall readCatch a signal and set a breakpoint:
catch signal <name|id>

# example
catch signal SIGTRAP
catch signal SIGSEGVCatch an assert, used to break execution when an assert() fails in the program:
cat assertGDB | Threads
Code: link
Thread | List
Syntax:
info threadsExample:
pwndbg> i threads
  Id   Target Id                                      Frame
* 1    Thread 0x7ffff7d92740 (LWP 5714) "gdb_threads" 0x00007ffff7e25a19 in ?? () from /usr/lib/libc.so.6
  2    Thread 0x7ffff7d916c0 (LWP 5715) "gdb_threads" 0x00007ffff7e76733 in clock_nanosleep ()
   from /usr/lib/libc.so.6
  3    Thread 0x7ffff75906c0 (LWP 5716) "gdb_threads" 0x00007ffff7e76733 in clock_nanosleep ()
   from /usr/lib/libc.so.6
  4    Thread 0x7ffff6d8f6c0 (LWP 5717) "gdb_threads" 0x00007ffff7e76733 in clock_nanosleep ()
from /usr/lib/libc.so.6Thread | Switch
Syntax:
thread <thread-id>
backtraceExample:
pwndbg> thread 2
[Switching to thread 2 (Thread 0x7ffff7d916c0 (LWP 5963))]
#0  0x00007ffff7e76733 in clock_nanosleep () from /usr/lib/libc.so.6

pwndbg> bt
#0  0x00007ffff7e76733 in clock_nanosleep () from /usr/lib/libc.so.6
#1  0x00007ffff7e82827 in nanosleep () from /usr/lib/libc.so.6
#2  0x00007ffff7e94f41 in sleep () from /usr/lib/libc.so.6
#3  0x000055555555523d in worker_function (arg=0x7fffffffd7f4) at gdb_threads.c:21
#4  0x00007ffff7e2939d in ?? () from /usr/lib/libc.so.6
#5 0x00007ffff7eae49c in ?? () from /usr/lib/libc.so.6Thread | Break
Syntax:
break <address> thread <thread-id>Thread | Watch
Syntax:
watch <variable_name> thread <thread-id>Example:
pwndbg> watch counter thread 3
Hardware watchpoint 1: counterThread | Detach
Detach a thread and let it run independently:
detach <thread_id>Example:
pwndbg> t 4
[Switching to thread 4 (Thread 0x7ffff6d8f6c0 (LWP 6120))]
Downloading 3.14 K source file /usr/src/debug/glibc/glibc/time/../sysdeps/unix/sysv/linux/clock_nanosleep.c
#0  0x00007ffff7e76733 in __GI___clock_nanosleep (clock_id=clock_id@entry=0, flags=flags@entry=0,
    req=req@entry=0x7ffff6d8ee60, rem=rem@entry=0x7ffff6d8ee60) at ../sysdeps/unix/sysv/linux/clock_nanosleep.c:48
48        r = INTERNAL_SYSCALL_CANCEL (clock_nanosleep_time64, clock_id, flags, req,

pwndbg> detach
Thread 3 incremented counter to 7
Detaching from program: /home/Axura/pwn/gdb_debug_skills/gdb_threads, process 6115
Thread 2 incremented counter to 8
Thread 1 incremented counter to 9
[Inferior 1 (process 6115) detached]

pwndbg> Thread 1 incremented counter to 10
Thread 2 incremented counter to 11
Thread 3 incremented counter to 12
Thread 2 incremented counter to 13
Thread 1 incremented counter to 14
Thread 3 incremented counter to 15
Final counter value: 15Thread | Scheduler-locking
The set scheduler-locking command in GDB controls how threads are scheduled during debugging.
off(Default)- All threads are allowed to run freely during program execution.
- When we issue a stepping command (
step,next), the program may switch between threads based on the operating system's thread scheduling. - Use this when we want the program to run as naturally as possible.
on- Only the current thread executes, while all other threads remain paused.
- Use this to focus exclusively on a single thread without interference from other threads.
step- Similar to
on, but with one key difference: When we issue stepping commands likestepornext, only the current thread runs. However, if we use a continuation command likecontinue, all threads will resume execution. - This option strikes a balance between isolating a single thread for stepping and letting the program continue naturally when needed.
- Similar to
Usage
Switch to the thread we want to debug:
thread 2Make sure only the current thread run:
set scheduler-locking onSet scheduler-locking to step:
set scheduler-locking step
set scheduler-locking stepiDebug with:
// Step current thread
s
// Run all threads
cThread | No-stop
Controls whether all threads stop when one thread hits a breakpoint or signal.
set non-stop on
set non-stop offon: Only the thread that hits the breakpoint (or signal) stops. Other threads keep running.off(default): All threads stop when one hits a breakpoint.
Useful for debugging live systems or multi-threaded programs where we don’t want all threads paused. Critical when debugging concurrent behaviors like race conditions or async I/O.
Thread | Async
Enables asynchronous execution of the debugged program—i.e., GDB doesn’t block while the program is running.
set target-async on/offon: GDB lets the program run in the background, and we can continue typing commands while it's running.off: GDB blocks and waits for the target to stop before returning control to us.
Thread | Bt
Backtrace for all threads:
thread apply all bt Example:
pwndbg> t apply all bt

Thread 4 (Thread 0x7ffff6d8f6c0 (LWP 2988) "gdb_threads"):
#0  0x00007ffff7e76733 in __GI___clock_nanosleep (clock_id=clock_id@entry=0, flags=flags@entry=0, req=req@entry=0x7ffff6d8ee60, rem=rem@entry=0x7ffff6d8ee60) at ../sysdeps/unix/sysv/linux/clock_nanosleep.c:48
#1  0x00007ffff7e82827 in __GI___nanosleep (req=req@entry=0x7ffff6d8ee60, rem=rem@entry=0x7ffff6d8ee60) at ../sysdeps/unix/sysv/linux/nanosleep.c:25
#2  0x00007ffff7e94f41 in __sleep (seconds=0) at ../sysdeps/posix/sleep.c:55
#3  0x000055555555523d in worker_function (arg=0x7fffffffd7bc) at gdb_threads.c:21
#4  0x00007ffff7e2939d in start_thread (arg=<optimized out>) at pthread_create.c:447
#5  0x00007ffff7eae49c in __GI___clone3 () at ../sysdeps/unix/sysv/linux/x86_64/clone3.S:78

Thread 3 (Thread 0x7ffff75906c0 (LWP 2987) "gdb_threads"):
#0  0x00007ffff7e76733 in __GI___clock_nanosleep (clock_id=clock_id@entry=0, flags=flags@entry=0, req=req@entry=0x7ffff758fe60, rem=rem@entry=0x7ffff758fe60) at ../sysdeps/unix/sysv/linux/clock_nanosleep.c:48
#1  0x00007ffff7e82827 in __GI___nanosleep (req=req@entry=0x7ffff758fe60, rem=rem@entry=0x7ffff758fe60) at ../sysdeps/unix/sysv/linux/nanosleep.c:25
#2  0x00007ffff7e94f41 in __sleep (seconds=0) at ../sysdeps/posix/sleep.c:55
#3  0x000055555555523d in worker_function (arg=0x7fffffffd7b8) at gdb_threads.c:21
#4  0x00007ffff7e2939d in start_thread (arg=<optimized out>) at pthread_create.c:447
#5  0x00007ffff7eae49c in __GI___clone3 () at ../sysdeps/unix/sysv/linux/x86_64/clone3.S:78

Thread 2 (Thread 0x7ffff7d916c0 (LWP 2986) "gdb_threads"):
#0  0x00007ffff7e76733 in __GI___clock_nanosleep (clock_id=clock_id@entry=0, flags=flags@entry=0, req=req@entry=0x7ffff7d90e60, rem=rem@entry=0x7ffff7d90e60) at ../sysdeps/unix/sysv/linux/clock_nanosleep.c:48
#1  0x00007ffff7e82827 in __GI___nanosleep (req=req@entry=0x7ffff7d90e60, rem=rem@entry=0x7ffff7d90e60) at ../sysdeps/unix/sysv/linux/nanosleep.c:25
#2  0x00007ffff7e94f41 in __sleep (seconds=0) at ../sysdeps/posix/sleep.c:55
#3  0x000055555555523d in worker_function (arg=0x7fffffffd7b4) at gdb_threads.c:21
#4  0x00007ffff7e2939d in start_thread (arg=<optimized out>) at pthread_create.c:447
#5  0x00007ffff7eae49c in __GI___clone3 () at ../sysdeps/unix/sysv/linux/x86_64/clone3.S:78

Thread 1 (Thread 0x7ffff7d92740 (LWP 2982) "gdb_threads"):
#0  0x00007ffff7e25a19 in __futex_abstimed_wait_common64 (private=128, futex_word=0x7ffff7d91990, expected=2986, op=265, abstime=0x0, cancel=true) at futex-internal.c:57
#1  __futex_abstimed_wait_common (futex_word=futex_word@entry=0x7ffff7d91990, expected=2986, clockid=clockid@entry=0, abstime=abstime@entry=0x0, private=private@entry=128, cancel=cancel@entry=true) at futex-internal.c:87
#2  0x00007ffff7e25a9f in __GI___futex_abstimed_wait_cancelable64 (futex_word=futex_word@entry=0x7ffff7d91990, expected=<optimized out>, clockid=clockid@entry=0, abstime=abstime@entry=0x0, private=private@entry=128) at futex-internal.c:139
#3  0x00007ffff7e2b1a3 in __pthread_clockjoin_ex (threadid=140737351587520, thread_return=0x0, clockid=0, abstime=0x0, block=<optimized out>) at pthread_join_common.c:102
#4  0x0000555555555303 in main () at gdb_threads.c:44
#5  0x00007ffff7dbae08 in __libc_start_call_main (main=main@entry=0x55555555524e <main>, argc=argc@entry=1, argv=argv@entry=0x7fffffffd908) at ../sysdeps/nptl/libc_start_call_main.h:58
#6  0x00007ffff7dbaecc in __libc_start_main_impl (main=0x55555555524e <main>, argc=1, argv=0x7fffffffd908, init=<optimized out>, fini=<optimized out>, rtld_fini=<optimized out>, stack_end=0x7fffffffd8f8) at ../csu/libc-start.c:360
#7 0x00005555555550f5 in _start ()GDB | Signal
Show current signal configuration
i signalSends a signal (e.g., SIGINT, SIGTERM, etc.) to the running process. We can send numeric signals (e.g., signal 11 for SIGSEGV) or symbolic ones (signal SIGINT):
signal <signo|name>Continue execution without sending any signal. Resumes the program but discards the current signal (Useful if GDB stopped on a signal and we want to ignore it while continuing):
signal 0Print or suppress signal output:
handle <signo> print/noprintStop or not on signal reception:
handle <signo> stop/nostopPass or block signal to the debuggee:
handle <signo> pass/nopassUsual setting:
handle SIGALRM nostop print nopassnostop: Don't stop execution whenSIGALRMis received.print: Show it in the terminal.nopass: Don't forward the signal to the target process.
This is useful when debugging a program that uses alarm() or timers, and we don’t want those signals interfering with your session (unless we do rely on this signal to process custom execution flow).
GDB | Display
Lists all currently active display expressions.
info displayAutomatically prints a variable or expression on every stop.
display <FMT> <expr>

# example
display /x my_var       # hex format
display /t flag         # binary
display /f my_float     # float
display /a ptr # address{FMT} is a format specifier (optional):
/x= hex/d= decimal/u= unsigned/t= binary/f= float/a= address/c= character
Stops displaying the expression with the given number (from info display):
undisplay <id>Example use case:
pwndbg> display $rax
1: $rax = 93824992235849

pwndbg> display /x $rax
2: /x $rax = 0x555555555149

pwndbg> n
4           char arr1[] = "bit";         // Null-terminated string, stored as {'b', 'i', 't', '\0'}.
1: $rax = 0
2: /x $rax = 0x0

pwndbg>
5           char arr2[3] = "bit";        // Compiler warning: no space for the null character.
1: $rax = 0
2: /x $rax = 0x0GDB | Dprintf
Sets a dynamic printpoint (a special breakpoint) that prints values without stopping program execution:
dprintf <location>, <format_string>, <arg1>, <arg2> ,,,For example:
dprintf main, "argc = %d\n", argc
dprintf myfunc:42, "x=%d, y=%d\n", x, yLists all breakpoints, including those created by dprintf:
info breakpointsExample use case:
pwndbg> l
1       #include <stdio.h>
2
3       int main() {
4           char arr1[] = "bit";         // Null-terminated string, stored as {'b', 'i', 't', '\0'}.
5           char arr2[3] = "bit";        // Compiler warning: no space for the null character.
6           char arr3[] = {'b', 'i', 't'}; // Not null-terminated.
7           char arr4[] = {'b', 'i', 't', '\0'}; // Explicit null character.
8
9           printf("%s\n", arr1); // Prints "bit".
10          printf("%s\n", arr2); // Undefined behavior (not null-terminated).
pwndbg>
11          printf("%s\n", arr3); // Undefined behavior (not null-terminated).
12          printf("%s\n", arr4); // Prints "bit".
13
14          return 0;
15      }

pwndbg> dprintf 9, "[!!!] Caution\n We found arr1 = %s\n", arr1
Dprintf 1 at 0x1182: file strings_example.c, line 9.

pwndbg> i b
Num     Type           Disp Enb Address            What
1       dprintf        keep y   0x0000000000001182 in main at strings_example.c:9
        printf "[!!!] Caution\n We found arr1 = %s\n", arr1

pwndbg> r
Starting program: /home/Axura/pwn/test/strings_example
Download failed: No route to host.  Continuing without separate debug info for system-supplied DSO at 0x7ffff7fc4000.
[Thread debugging using libthread_db enabled]
Using host libthread_db library "/usr/lib/libthread_db.so.1".
[!!!] Caution
We found arr1 = bit
bit
bitbitbit
bitbit
bitGDB | Disassemble
Disassemble starting at start, for len bytes:
disassemble <start>,+<len>Disassemble the instruction range from start to end:
disassemble <start>,<end>Example
Code: link
Disassemble the function:
pwndbg> disassemble add_numbers
Dump of assembler code for function add_numbers:
   0x0000555555555139 <+0>:       push   rbp
   0x000055555555513a <+1>:       mov    rbp,rsp
   0x000055555555513d <+4>:       mov    DWORD PTR [rbp-0x14],edi
   0x0000555555555140 <+7>:       mov    DWORD PTR [rbp-0x18],esi
   0x0000555555555143 <+10>:      mov    edx,DWORD PTR [rbp-0x14]
   0x0000555555555146 <+13>:      mov    ecx,DWORD PTR [rbp-0x18]
   0x0000555555555149 <+16>:      mov    eax,edx
   0x000055555555514b <+18>:      add    eax,ecx
   0x000055555555514d <+20>:      mov    edx,eax
   0x000055555555514f <+22>:      mov    DWORD PTR [rbp-0x4],edx
   0x0000555555555152 <+25>:      mov    eax,DWORD PTR [rbp-0x4]
   0x0000555555555155 <+28>:      pop    rbp
   0x0000555555555156 <+29>:      ret
End of assembler dump.Switch to TUI mode for assembly view:
layout asm
# To exit window: ctrl+x + aSet a breakpoint in the function and step through the assembly:
break add_numbers
run
stepi   # Step one assembly instruction
nexti # Skip over function callsObserve register values after each instruction:
info registers
# or in pwndbg
regsGDB | Frame
Manipulate the stack frame allocated when function calls.
Print the call stack (traceback), depth controls how deep:
backtrace <depth>

# or
bt <depth>Display the current stack frame (function context):
frameMove up or down in the call stack (to previous/next frame):
up
downPrint local variables in the current stack frame:
info localsExample:
pwndbg> bt
#0  main () at pthread_attr_demo.c:35
#1  0x00007ffff7db8488 in __libc_start_call_main (main=main@entry=0x555555555208 <main>, argc=argc@entry=1, argv=argv@entry=0x7fffffffd8e8)
at ../sysdeps/nptl/libc_start_call_main.h:58
#2  0x00007ffff7db854c in __libc_start_main_impl (main=0x555555555208 <main>, argc=1, argv=0x7fffffffd8e8, init=<optimized out>, fini=<optimized out>,
rtld_fini=<optimized out>, stack_end=0x7fffffffd8d8) at ../csu/libc-start.c:360
#3  0x0000555555555105 in _start ()

pwndbg> frame
#0  main () at pthread_attr_demo.c:35
35          pthread_attr_destroy(&attr);

pwndbg> i locals
attr = {
__size = '\000' <repeats 17 times>, "\020", '\000' <repeats 16 times>, " ", '\000' <repeats 20 times>,
__align = 0
}
thread = 140737351571136
err = 0
stacksize = 2097152

pwndbg> down
► 0   0x5555555552b2 main+170
1   0x7ffff7db8488 __libc_start_call_main+120
2   0x7ffff7db854c __libc_start_main+140
3 0x555555555105 _start+37GDB | Processes
Process | Switch
List all inferiors (processes GDB is debugging):
info inferiors Switch between parent and child processes using:
inferior <id>Process | Catch
Breakpoints set in the parent process before the fork() are copied into the child process. We can continue debugging both processes by switching between them.
catch fork: Stops execution when afork()is called.catch vfork: Stops execution when avfork()is called.
catch fork
// or
catch vforkProcess | Detach-on-fork
On | Off
set detach-on-fork on|off
on: GDB detaches from the child process after afork(). It continues to debug only the parent process (default behavior).off: GDB does not detach from the child process. Both parent and child processes remain under GDB control, and we can switch between them usinginferiorcommands.
Example:
set detach-on-fork offParent | Child
set follow-fork-mode parent|child
parent: GDB continues debugging the parent process after afork().child: GDB switches to debug the child process after afork().
Example:
set follow-fork-mode childDebug Code
Code: link
Configures GDB to switch focus to the child process after fork():
pwndbg> set detach-on-fork off
pwndbg> set follow-fork-mode child

pwndbg> r
Starting program: /home/Axura/pwn/gdb_debug_skills/gdb_processes
Downloading separate debug info for /lib64/ld-linux-x86-64.so.2
[Thread debugging using libthread_db enabled]
Using host libthread_db library "/usr/lib/libthread_db.so.1".
Parent process: PID = 2948
[Attaching after Thread 0x7ffff7d92740 (LWP 2948) fork to child process 2952]
[New inferior 2 (process 2952)]
[Thread debugging using libthread_db enabled]
Using host libthread_db library "/usr/lib/libthread_db.so.1".
Child process: PID = 2952, Parent PID = 2948
Child process: global_var = 15
Process PID = 2952 exiting.
[Inferior 2 (process 2952) exited normally]- The parent process starts (PID = 2948).
- GDB detects the
fork()and attaches to the child process (PID = 2952) while retaining information about the parent. - The child process executes its specific code:
- Prints its
PIDand parentPID. - Updates the
global_varto 15 and prints it.
- Prints its
- The child process exits normally, and GDB remains ready for further actions.
To debug the parent process as well, you can switch back to it using:
pwndbg> inferior 1
[Switching to inferior 1 [process 2948] (/home/Axura/pwn/gdb_debug_skills/gdb_processes)]
[Switching to thread 1.1 (Thread 0x7ffff7d92740 (LWP 2948))]Add catch fork to pause execution right before the fork():
pwndbg> catch fork
Catchpoint 1 (fork)Use info inferiors to see all processes GDB is attached to:
pwndbg> info inferiors
  Num  Description       Connection           Executable
* 1    process 2948      1 (native)           /home/Axura/pwn/gdb_debug_skills/gdb_processes
2 <null> /home/Axura/pwn/gdb_debug_skills/gdb_processesGDB | Checkpoint
GDB's checkpoint feature allows us to save and restore the execution state of a program mid-debugging — very useful for exploring alternate paths without restarting everything.
Saves the current state of program execution (memory, registers, etc.):
checkpointThink of it like a save state in an emulator — lets us return to this point later.
Lists all saved checkpoints, each with an ID, location, and status:
info checkpointsRemoves a specific checkpoint by ID to free memory or clean up:
delete checkpoint <id>Restores execution to the state of a given checkpoint (by ID):
restart <id>Typical Use Case:
pwndbg> b main
Breakpoint 1 at 0x113d: file g_var.c, line 7.

pwndbg> r
Starting program: /home/Axura/pwn/test/g_var

pwndbg> checkpoint
checkpoint 1: fork returned pid 2827.

pwndbg> n
pwndbg> n
pwndbg> n
...

pwndbg> i checkpoints
* 0 Thread 0x7ffff7d8e740 (LWP 2821) (main process) at 0x55555555515f, file g_var.c, line 8
1 process 2827 at 0x55555555513d, file g_var.c, line 7

pwndbg> restart 1
...This is powerful for reversing, exploit path testing, or state comparison — especially if we're dealing with nondeterministic behavior or race conditions.
GDB | Record
An execution recording capabilities to help debug and analyze program state changes over time - an upgraded version of checkpoint command.
The record feature is used to trace program execution, allowing us to inspect past instructions, function calls, and control flow.
Basic Usage
gdb ./pwnInside GDB:
pwndbg> start
pwndbg> recordOr some other options:
record full           # Start full execution recording
record btrace # Start branch trace recording (less overhead)We can also abbreviate:
record f              # Equivalent to record full
record b # Equivalent to record btraceDelete the current execution log and restart recording:
record delete
record del
record dStop recording:
record stop
record sSave the recorded log to a file:
record saveGo to a specific instruction number in the log:
record goto <N>Show function-level execution history (required record full):
record function-call-historyPrint disassembled instruction history (required record full):
record instruction-historyWorkflow
start
record full
continue
record instruction-history  # Only when record full
reverse-stepi				# where we can step back!
record goto 100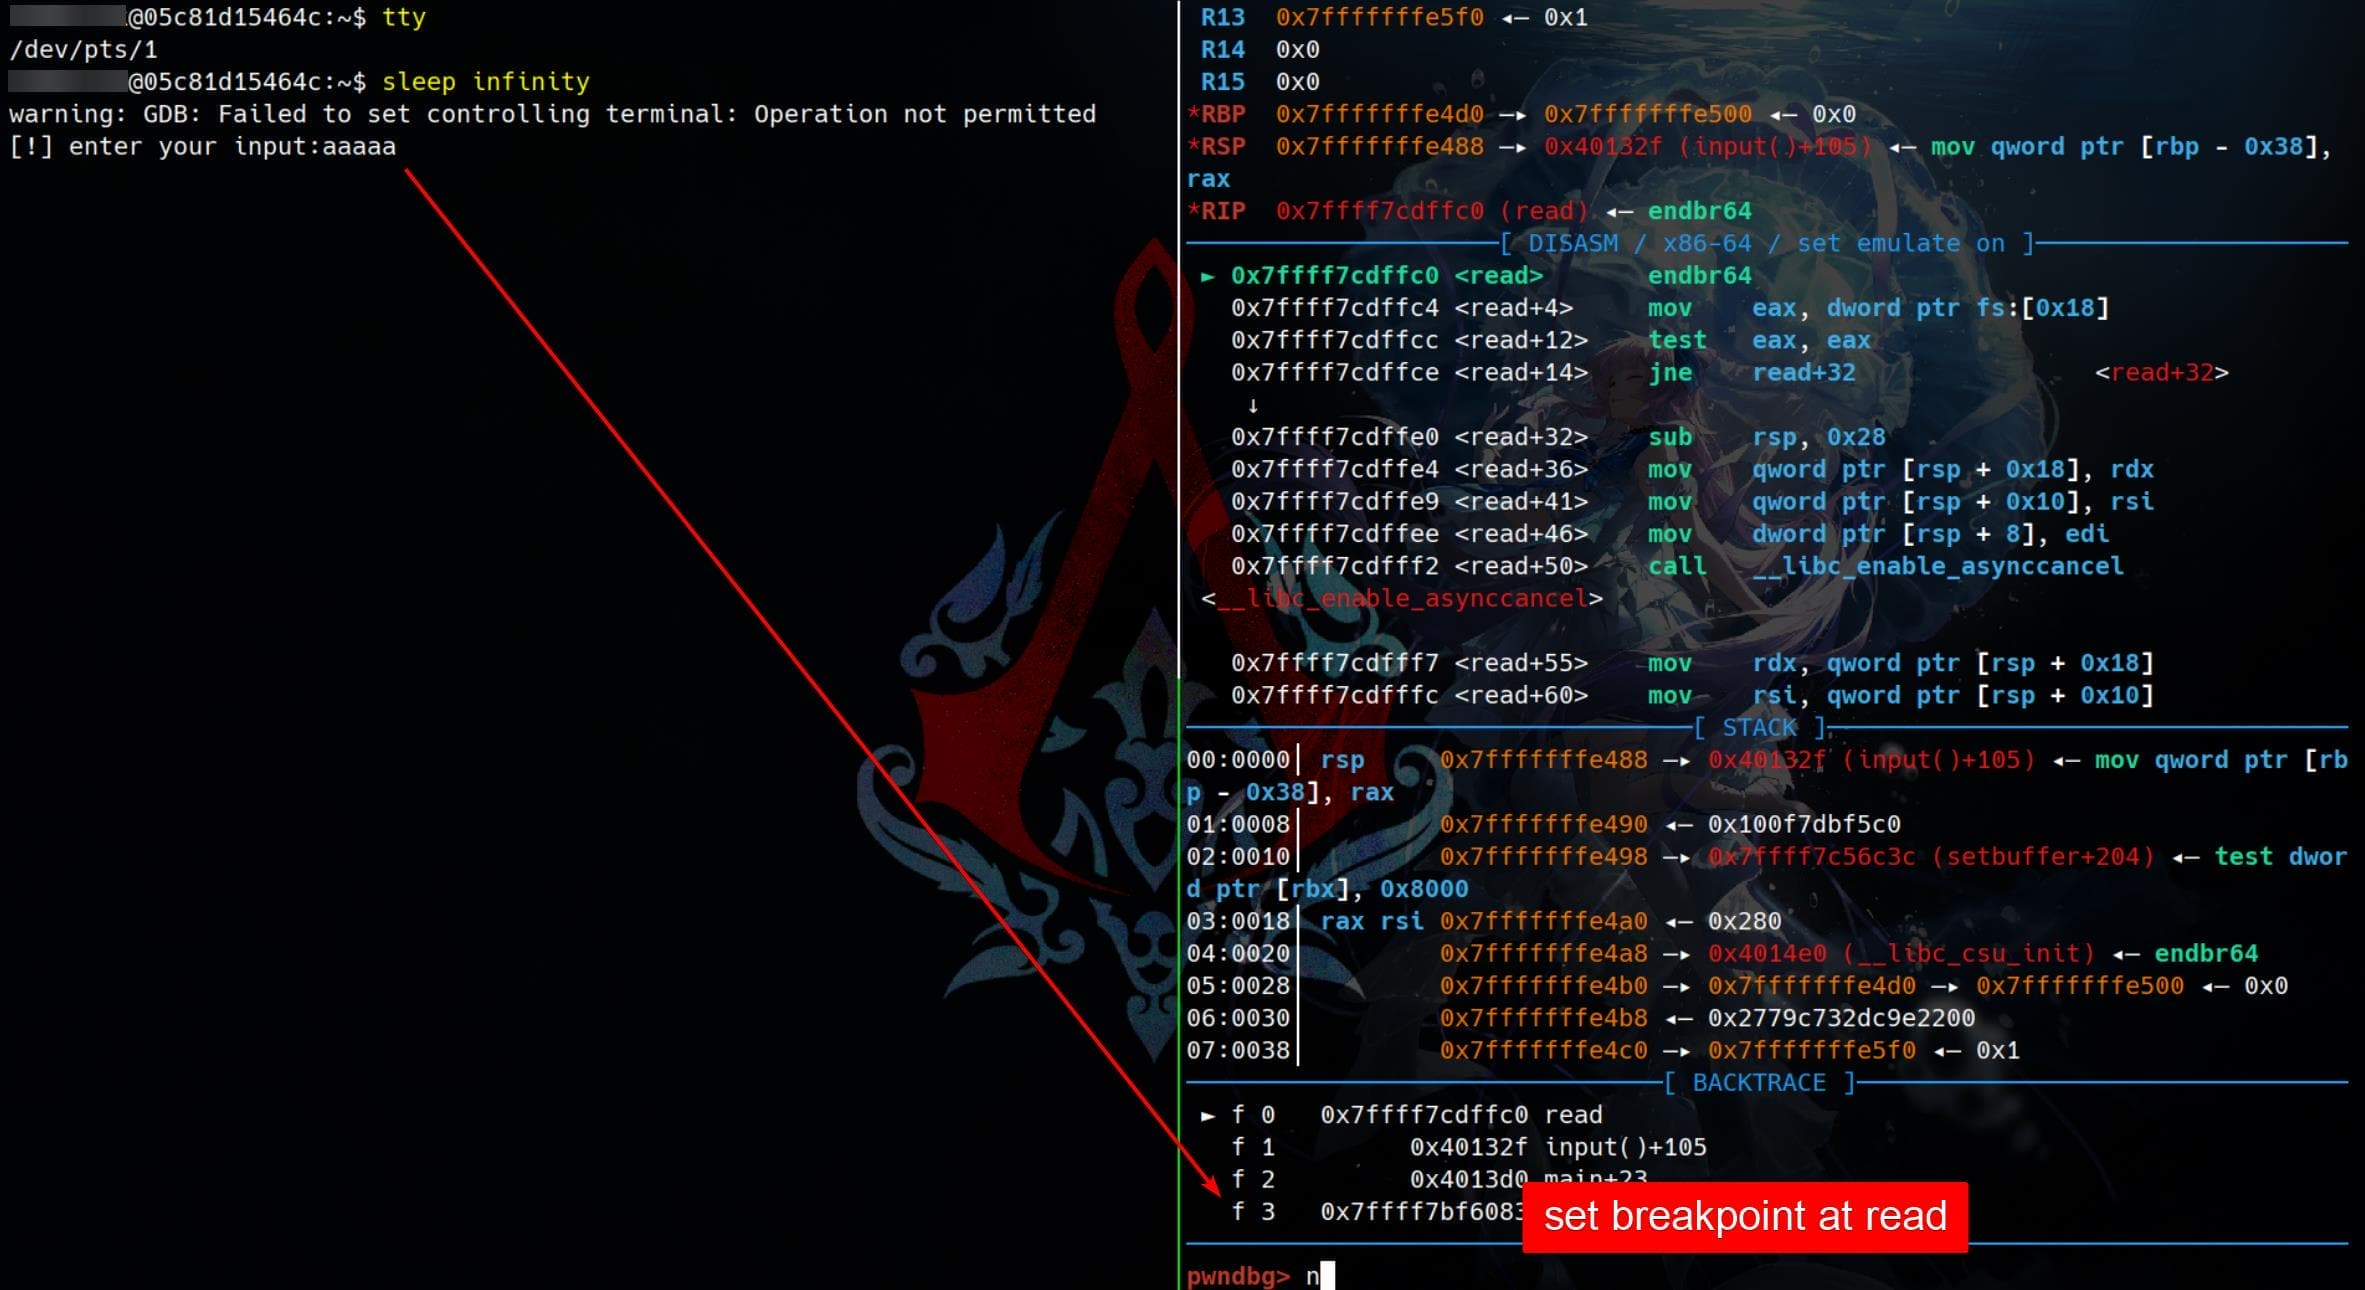
record stop GDB | TTY
Allow the debugged program to use a different terminal (TTY) for I/O, while keeping GDB interaction in our main terminal.
In one terminal:
ttyExample output:
/dev/pts/2In the other terminal, run GDB with the program and attach the TTY:
gdb -q --tty=/dev/pts/2 ./programThen in GDB:
run <args...>Now, the program's input/output will appear in /dev/pts/2 (the first terminal), while we control GDB in the second one.
It's recommended to run this in the I/O terminal:
sleep infinityto keep the terminal alive while waiting for input/output.
Example use case:
Using a separate TTY for GDB I/O is especially useful when debugging qemu-based programs.
When we debug a QEMU-based binary with GDB, pressing Ctrl+C in a shared terminal:
- Sends SIGINT (0xcc) to both GDB and the QEMU process.
- This kills QEMU, potentially losing all debugging context/state.
By assigning the QEMU target program its own terminal (TTY) for I/O:
Ctrl+Conly interrupts GDB, not the QEMU process.- We retain control of the debugger without crashing the emulated system!
GDB | Docker
Install gdbserver on the docker container, and start it where the binary is running:
gdbserver 127.0.0.1:port ./pwnRun the gdb command on the local machine:
gdb -q \
	-ex 'target remote 127.0.0.1:port'
./pwnGDB | TUI
TUI
The layout command in GDB is used to display different text-based layouts in the TUI (Text User Interface) mode. This mode enhances the debugging experience by showing various aspects of the program's state, such as source code, assembly, registers, or memory, alongside the GDB command line.
Enter/Exit TUI Mode:
tui enable
tui disableSyntax:
layout <type>Switch Windows: Press Ctrl-x followed by o to cycle through different windows (source, assembly, registers, etc.).
While in TUI mode, press Ctrl-x followed by 1 to close all additional TUI windows and return to a single command-line window.
Scroll Source Code: Use the arrow keys or Ctrl-P (up), Ctrl-N (down) to navigate the source code window.
Scroll Assembly Instructions: Use the Page Up and Page Down keys or Ctrl-U/Ctrl-D.
Layout
Displays the source code window. This is the default layout when entering TUI mode:
layout srcDisplays the disassembled instructions for the current function or address. Useful for debugging at the assembly level:
layout asmDisplays both the source code and assembly windows side by side, allowing us to correlate source lines with assembly instructions:
layout splitDisplays a window with the current values of registers alongside the source code or assembly. This is especially helpful for low-level debugging:
layout regsGDB | Core Dump
Debugging a core dump file is a way to analyze a program that has crashed. The core dump contains a snapshot of the program's memory and execution state at the moment of the crash. Using GDB, we can inspect this snapshot to identify the cause of the crash.
Ulimit
By default, many Linux systems disable core dumps. We can enable them in the shell:
ulimit -c unlimitedThis allows the system to generate core dump files when a program crashes.
We can make this setting permanent by adding it to our shell's configuration file (e.g., .zshrc) or by modifying /etc/security/limits.conf.
Dump
Run the program as usual. If it crashes, a core dump file will be generated, typically named core or core.<pid>.
For example:
./myprogram
Segmentation fault (core dumped)Coredumpctl
Modern Linux systems use core_pattern to define where core dumps are stored. Check the current pattern with:
cat /proc/sys/kernel/core_patternCheck the Core Dump List managed by systemd-coredump:
coredumpctl listView Core Dump Details:
coredumpctl info <PID>Access or Save the Core Dump:
coredumpctl dump <PID> > coreThis saves the core dump to a file named core in the current directory.
Debug
Run GDB, specifying both the executable and the core dump file:
gdb myprogram coreGDB will load the program and the core dump, showing information about the crash.
Example
Code: link
Crash with core dumped:
ulimit -c unlimited

./gdb_crash
Program is about to crash...
[1] 8416 segmentation fault (core dumped) ./gdb_crashList core dumps:
$ coredumpctl list
TIME                           PID  UID  GID SIG     COREFILE EXE                                                   >
Thu 2024-11-14 23:01:05 PST   1739 1000 1000 SIGABRT missing  /usr/bin/dolphin                                      >
Thu 2024-11-14 23:02:49 PST   1929 1000 1000 SIGABRT missing  /usr/bin/dolphin                                      >
Fri 2024-11-15 18:26:06 PST   1022 1000 1000 SIGABRT missing  /usr/lib/kf6/baloo_file                               >
Sat 2024-11-16 00:15:10 PST   1174 1000 1000 SIGSEGV missing  /usr/bin/plasmashell                                  >
Sat 2024-11-16 00:29:45 PST   4287 1000 1000 SIGSEGV missing  /usr/bin/plasmashell                                  >
Sat 2024-11-16 00:39:10 PST   4929 1000 1000 SIGSEGV missing  /usr/bin/plasmashell                                  >
Sat 2024-11-16 01:09:53 PST   5284 1000 1000 SIGSEGV missing  /usr/bin/plasmashell                                  >
Sat 2024-11-16 17:45:41 PST   2707 1000 1000 SIGTRAP missing  /usr/lib/electron32/electron                          >
Sat 2024-11-16 17:49:58 PST   2975 1000 1000 SIGTRAP missing  /usr/lib/electron32/electron                          >
Sat 2024-11-16 17:50:07 PST   3462 1000 1000 SIGTRAP missing  /usr/lib/electron32/electron                          >
Sat 2024-11-16 17:50:19 PST   3648 1000 1000 SIGTRAP missing  /usr/lib/electron32/electron                          >
Sat 2024-11-16 17:50:37 PST   3829 1000 1000 SIGTRAP missing  /usr/lib/electron32/electron                          >
Sat 2024-11-16 18:49:36 PST  12106    0    0 SIGTRAP none     /home/Axura/hacktools/BloodHound-linux-x64/BloodHound >
Sat 2024-11-16 18:49:48 PST  12431    0    0 SIGTRAP none     /home/Axura/hacktools/BloodHound-linux-x64/BloodHound >
Sat 2024-11-16 18:58:50 PST   1026 1000 1000 SIGSEGV present  /usr/lib/kf6/baloo_file                               >
Sat 2024-11-16 23:21:16 PST   1036 1000 1000 SIGSEGV present  /usr/lib/kf6/baloo_file                               >
Fri 2024-11-22 00:20:41 PST 117392 1000 1000 SIGTRAP present  /usr/lib/electron32/electron                          >
Fri 2024-11-22 00:21:00 PST 117641 1000 1000 SIGTRAP present  /usr/lib/electron32/electron                          >
Sat 2024-11-23 20:26:56 PST  10388 1000 1000 SIGSEGV present  /usr/bin/wireshark                                    >
Sat 2024-11-30 18:48:05 PST 8416 1000 1000 SIGSEGV present /home/Axura/pwn/gdb_debug_skills/gdb_crashView core dump detais:
$ coredumpctl info 8416
           PID: 8416 (gdb_crash)
           UID: 1000 (Axura)
           GID: 1000 (Axura)
        Signal: 11 (SEGV)
     Timestamp: Sat 2024-11-30 18:48:05 PST (13min ago)
  Command Line: ./gdb_crash
    Executable: /home/Axura/pwn/gdb_debug_skills/gdb_crash
 Control Group: /user.slice/user-1000.slice/[email protected]/app.slice/app-org.kde.konsole\x20\x281\x29@ea52d423206>
          Unit: [email protected]
     User Unit: app-org.kde.konsole\x20\x281\[email protected]
         Slice: user-1000.slice
     Owner UID: 1000 (Axura)
       Boot ID: 169ecd2ee4ee4f8aa9e8bfaff8ff244a
    Machine ID: 2a180b57a01b47d2b908871416ec7367
      Hostname: arLinuxA
       Storage: /var/lib/systemd/coredump/core.gdb_crash.1000.169ecd2ee4ee4f8aa9e8bfaff8ff244a.8416.1733021285000000>
  Size on Disk: 19.1K
       Message: Process 8416 (gdb_crash) of user 1000 dumped core.

                Stack trace of thread 8416:
                #0  0x000060111f49c149 n/a (/home/Axura/pwn/gdb_debug_skills/gdb_crash + 0x1149)
                #1  0x000060111f49c16f n/a (/home/Axura/pwn/gdb_debug_skills/gdb_crash + 0x116f)
                #2  0x00007a8e18618e08 n/a (libc.so.6 + 0x25e08)
                #3  0x00007a8e18618ecc __libc_start_main (libc.so.6 + 0x25ecc)
                #4  0x000060111f49c065 n/a (/home/Axura/pwn/gdb_debug_skills/gdb_crash + 0x1065)
                ELF object binary architecture: AMD x86-64
Save core dump in current directory:
$ coredumpctl dump 8416 > coreDebug with core dump:
gdb gdb_crash coreBacktrace to see the function calls:
pwndbg> bt
#0  0x000060111f49c149 in faulty_function () at gdb_crash.c:6
#1  0x000060111f49c16f in main () at gdb_crash.c:11
#2  0x00007a8e18618e08 in __libc_start_call_main (main=main@entry=0x60111f49c152 <main>, argc=argc@entry=1,
    argv=argv@entry=0x7fff1db153c8) at ../sysdeps/nptl/libc_start_call_main.h:58
#3  0x00007a8e18618ecc in __libc_start_main_impl (main=0x60111f49c152 <main>, argc=1, argv=0x7fff1db153c8,
    init=<optimized out>, fini=<optimized out>, rtld_fini=<optimized out>, stack_end=0x7fff1db153b8)
    at ../csu/libc-start.c:360
#4 0x000060111f49c065 in _start ()Switch to the faulting frame:
pwndbg> frame 0
#0  0x000060111f49c149 in faulty_function () at gdb_crash.c:6
6 *ptr = 42; // This will cause a segmentation faultCheck:
pwndbg> l
1       #include <stdio.h>
2       #include <stdlib.h>
3
4       void faulty_function() {
5           int *ptr = NULL;
6           *ptr = 42; // This will cause a segmentation fault
7       }
8
9       int main() {
10          printf("Program is about to crash...\n");

pwndbg> p ptr
$1 = (int *) 0x0Or Inspect local variables:
pwndbg> info locals
ptr = 0x0This confirms the crash was caused by dereferencing a null pointer.
GDB | Define
Define our own commands in GDB.
Set | Function
We can use the set command to define a custom symbol for a function, especially useful for a stripped binary:
set $myfunc = (void (*)()) 0x123456then we can call it:
call $myfunc()Set | Variable
We can define a custom symbol for a variable at a specific memory address, especially useful for a stripped binary:
set $myvar = *(int *)0x123456Define | Hook-stop
Automatically run bt and info registers every time execution stops:
define hook-stop
bt
info registers
endCustom | inject.gdb
Inject Strings & Bytes Into GDB Running Process. Craft the input and redirect it into the process's stdin via /proc/<pid>/fd/0.
define inject
    if $argc == 0
        printf "Usage: inject <python-bytestr>\n"
        printf "Example: inject 'b\"ABC\\x00\\xff\"'\n"
    else
        set $pid = $_pid
        shell python3 -c "import sys; sys.stdout.buffer.write($arg0)" > /proc/$pid/fd/0
        printf "Injected bytes into /proc/%d/fd/0\n", $pid
    end
end

document inject
Inject arbitrary bytes into the debuggee's stdin using /proc/<pid>/fd/0.

Usage:
    inject 'b"ABC\\x00\\xff"'

Note:
    - Make sure the process is paused at a point where it is waiting for input (e.g., fgets/read).
    - This uses python3 to write binary-safe payloads.

Example:
    (gdb) inject 'b"A"*64 + b"\\xef\\xbe\\xad\\xde"'
endCustom | PIE base
Show memory data and make breakpoints related to base address when PIE enabled:
# Define `sbase`: PIE-aware memory view
define sbase
    if $argc == 1
        telescope $rebase($arg0) 10
    end

    if $argc == 2
        telescope $rebase($arg0) $arg1
    end
end

document sbase
Show memory contents at a PIE-adjusted address using telescope.

Usage:
    sbase <address>           - Show 10 entries from address + base
    sbase <address> <count>   - Show <count> entries from address + base

Note:
    - Requires a $rebase function (e.g., via Pwngdb or manual setup).
    - Useful for examining stack or heap in PIE binaries.
end


# Define `bbase`: PIE-aware breakpoint
define bbase
    b *$rebase($arg0)
end

document bbase
Set a breakpoint at a PIE-adjusted address.

Usage:
    bbase <offset>

Example:
    bbase 0x1234   - Breaks at (base + 0x1234)

Note:
    - Requires a $rebase function to compute the correct address.
    - Especially useful when debugging PIE binaries where fixed offsets are needed.
endGDB | Pattern
Create pattern for input.
Pattern | Cyclic
Create pattern:
pwndbg> cyclic 64
aaaaaaaabaaaaaaacaaaaaaadaaaaaaaeaaaaaaafaaaaaaagaaaaaaahaaaaaaaUse cyclic -l to find the exact offset:
cyclic -l 0x61616164This will tell us the exact offset where the buffer overflow occurred.
Or search for the pattern in memory:
find $sp, $sp+200, "cyclic_pattern"Or check a specific memory address:
x/s <address>Pattern | Python
Create pattern:
pwndbg> python print("A" * 64)
AAAAAAAAAAAAAAAAAAAAAAAAAAAAAAAAAAAAAAAAAAAAAAAAAAAAAAAAAAAAAAAAGDB | add-symbol-file
When we only have headers, and we need to Inject types via a “types-only” object. This is the most reliable “import” when we don’t have debuginfo for the real binary but do have the headers — gives a real DWARF type info in GDB so we can ptype, print *(struct ...), and use member syntax.
Step 1 - Reverse the struct and write a header (example):
/* mytypes.h — your reverse-engineered layout */
/* Example: 64-bit little-endian target */
#include <stdint.h>

struct Node {
    struct Node *next;    /* 8 bytes at offset 0 */
    uint64_t id;          /* 8 bytes at offset 8 */
    char name[16];        /* 16 bytes at offset 16 */
    /* total size: 32 bytes */
};

struct List {
    struct Node *head;    /* 8 */
    uint32_t count;       /* 4 */
    /* 4 bytes padding on 64-bit to align next pointer */
    void *owner;          /* 8 */
};Step 2 - Create a tiny TU that includes the header and produces DWARF:
/* types.c */
#include "mytypes.h"
void __gdb_types_anchor(void) {} /* one symbol so obj is non-empty */Step 3 - Build with debug info (Arch / GCC/Clang):
gcc -g -c types.c -o /tmp/types.o
# or clang -g -c types.c -o /tmp/types.oStep 4 - Start gdb on the real binary and load the types:
gdb ./the_real_binary
(gdb) add-symbol-file /tmp/types.o 0
# load address 0 is fine because we only want DWARF/type info
# [removal]: remove-symbol-file /tmp/types.o
(gdb) ptype struct List # now gdb knows your structStep 5 - Inspect memory using the declared type:
# cast and dereference
(gdb) p *(struct List *)0x7fffffffe000
# print single field
(gdb) p ((struct List *)0x7fffffffe000)->count

# inspect head node and its id:
(gdb) set $L = (struct List *)0x7fffffffe000
(gdb) p $L->head
(gdb) p *$L->head
(gdb) p $L->head->id
(gdb) p $L->head->name      # prints as array of chars; or use x/s:
(gdb) x/s $L->head->namePwndbg | Contextwatch
Create a new window to monitor data modification:
contextwatch [{eval,execute}] <expression>For example:
contextwatch $rax+$rbx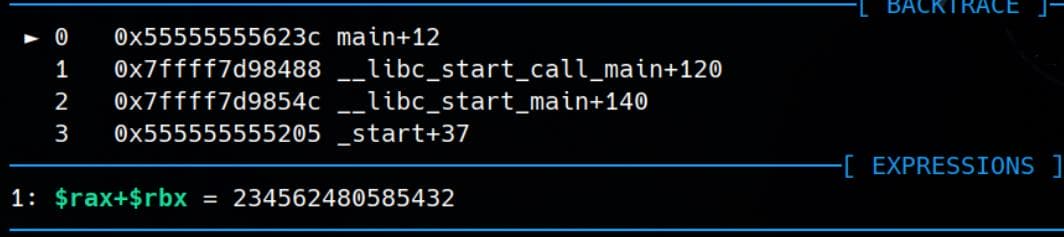
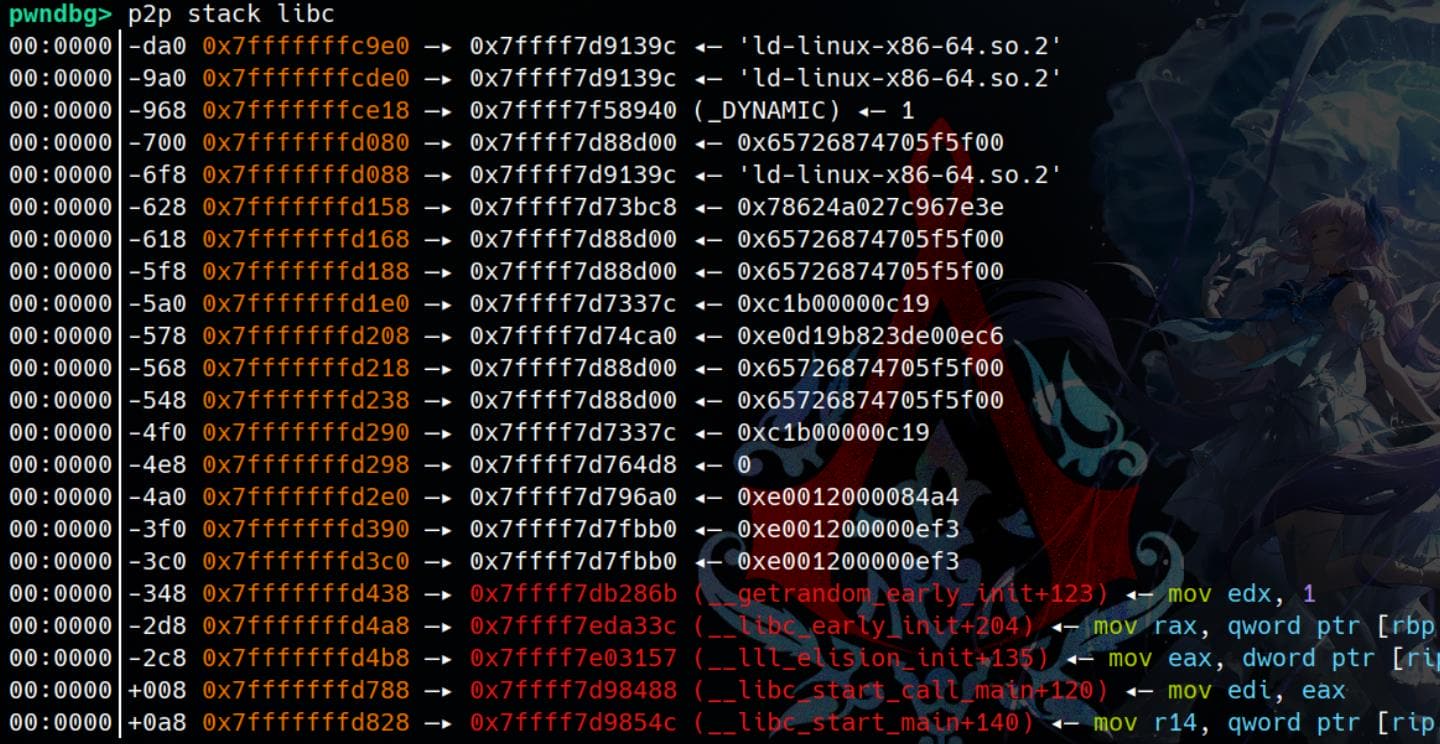
Pwndbg | p2p
Look for pointers located somewhere. Very useful when when we need to leak addresses:
p2p <mapping_names> <mapping_names> For example:L
p2p stack libc
p2p stack ldLooking at stack for pointer that point to libc:
Pwngdb
Overview
An extension on Pwndbg. Good for heap, IO struct debugging.
Install from https://github.com/scwuaptx/Pwngdb.
Edit .gdbinit:
source <path_to_Pwngdb>/Pwngdb/pwngdb.py
source <path_to_Pwngdb>/angelheap/gdbinit.py

define hook-run
python
import angelheap
angelheap.init_angelheap()
end
endHeap Exploitation Commands (Some are already intergrated into the modern Pwndbg):
libc : Print the base address of libc
ld : Print the base address of ld
codebase : Print the base of code segment
heap : Print the base of heap
got : Print the Global Offset Table information
dyn : Print the Dynamic section information
findcall : Find some function call
bcall : Set the breakpoint at some function call
tls : Print the thread local storage address
at : Attach by process name
findsyscall : Find the syscall
fmtarg : Calculate the index of format string
You need to stop on printf which has vulnerability.
force : Calculate the nb in the house of force
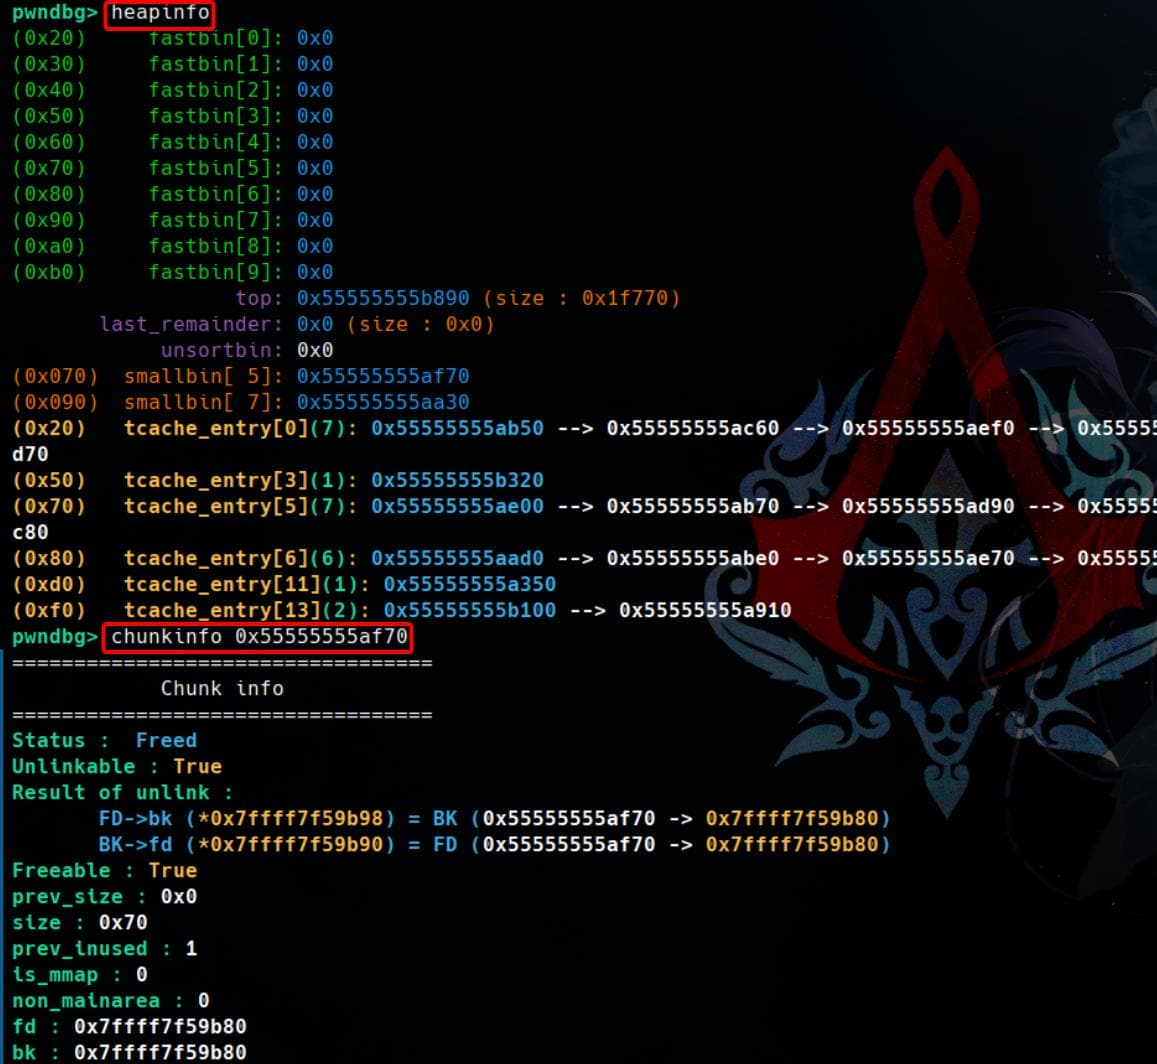
heapinfo : Print some information of heap
Usage: heapinfo (default = current thread's arena)
Shows tcache entry info if tcache is enabled
heapinfoall : Print some information of heap (all threads)
arenainfo : Print some information of all arena
chunkinfo : Print the information of a chunk
Usage: chunkinfo <address of victim>
chunkptr : Print the information of a chunk from a user ptr
Usage: chunkptr <address of user ptr>
mergeinfo : Print the information of merge
Usage: mergeinfo <address of victim>
printfastbin : Print some information of fastbin
tracemalloc on : Trace malloc and free, and detect some error
Run the process first, then enable tracemalloc
Enable DEBUG in pwngdb.py to print all malloc/free info
parseheap : Parse heap layout
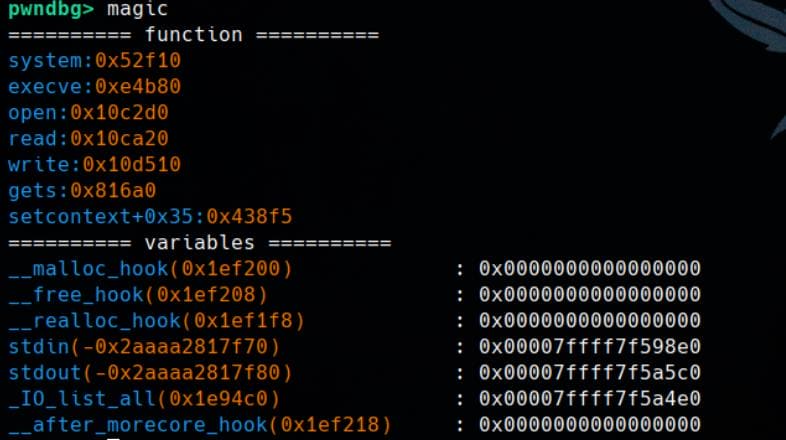
magic : Print useful variables and functions in glibc
fp : Show FILE structure
Usage: fp <address of FILE>
fpchain : Show linked list of FILE
orange : Test house of orange condition in _IO_flush_lockp
Usage: orange <address of FILE>
Note: Some commands depend on glibc version (e.g., 'orange' for <= 2.23).Pwngdb | Info
Run heapinfo or chunkinfo + <location> for a nice looking (or check chunk integration):
Pwngdb | fpchain
fpchain command shows the internal _IO_FILE linked list of standard streams maintained by glibc, in this order:
stderr→stdout→stdin
Each of these pointers is part of a doubly-linked list (_chain) of active FILE streams.
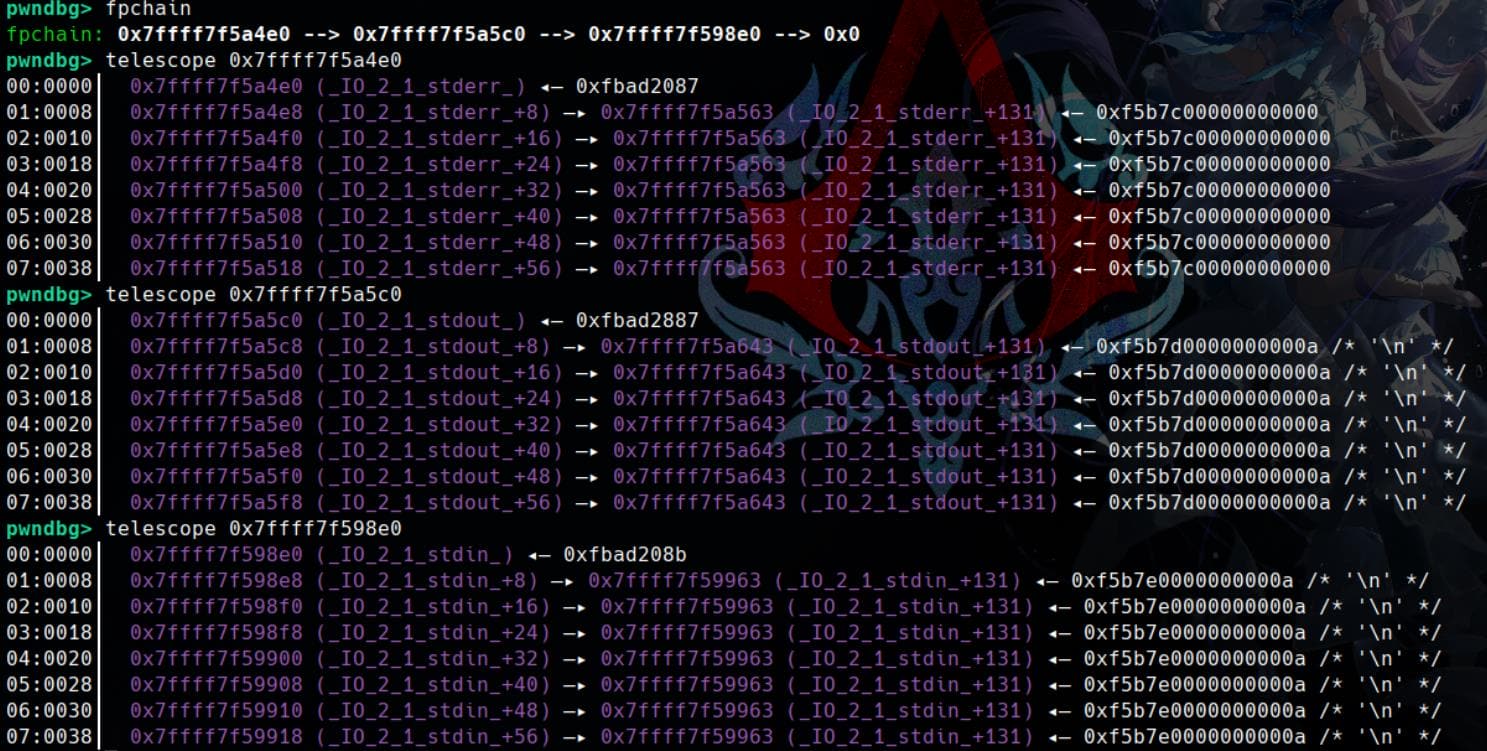
This direction comes from the internal glibc FILE structure implementation and how it builds the _IO_list_all linked list of active FILE streams.
_IO_list_all → stderr → stdout → stdin → NULLIn glibc (e.g., glibc/stdio-common/stdio_init.c), the standard streams (stdin, stdout, stderr) are initialized during program startup, but not in the logical order we'd expect (stdin → stdout → stderr). Instead, their order in the linked list is:
_IO_2_1_stderr_.chain → _IO_2_1_stdout_.chain → _IO_2_1_stdin_.chain → NULLThis order is explicitly set in libc code like:
_IO_link_in ((struct _IO_FILE_plus *) &_IO_2_1_stderr_);
_IO_link_in ((struct _IO_FILE_plus *) &_IO_2_1_stdout_);
_IO_link_in ((struct _IO_FILE_plus *) &_IO_2_1_stdin_);So, the last one initialized (stdin) ends up at the end of the linked list.
Pwngdb | fp
Show FILE (_IO_FILE) structure conveniently, so we don't need to specify the pointer type:
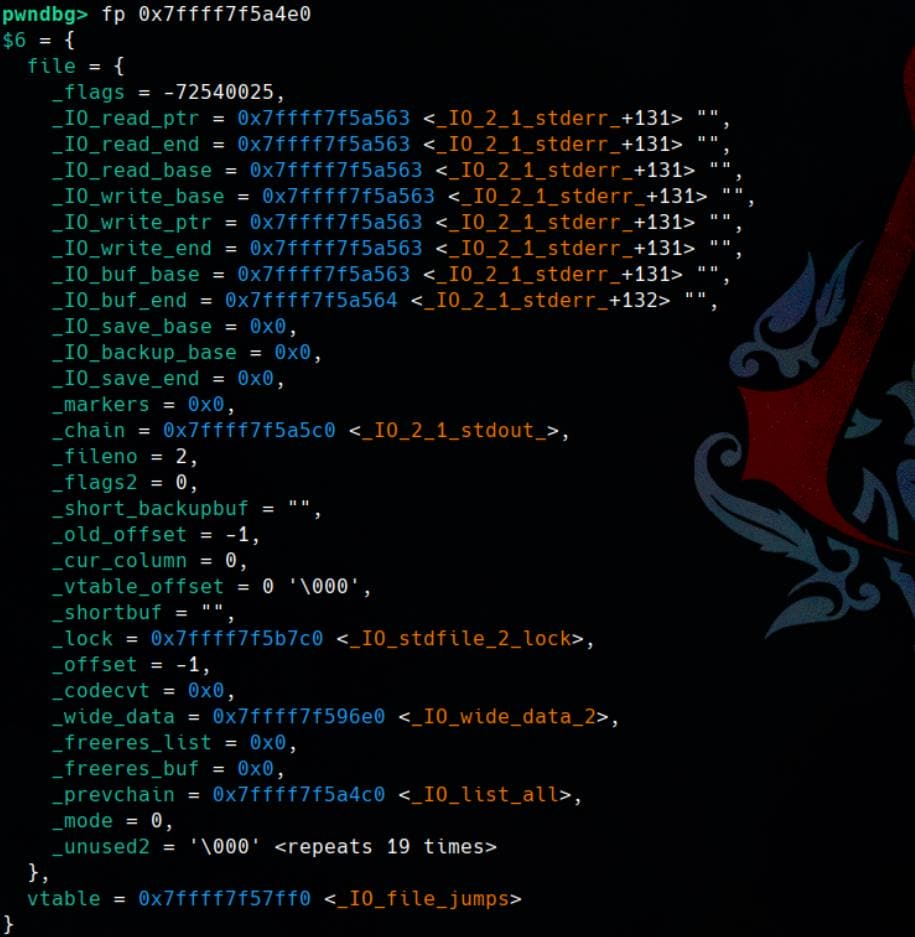
This equals to p (struct _IO_FILE_plus*)<address> but less colorful of course.
Pwngdb| magic
Show MAGIC things in Glibc:
Compile | Gcc
Compile C code with specific LD and LIBC:
gcc -o kxheap kxheap.c -L/home/axura/pwn/kxheap/2.35 -Wl,--dynamic-linker=/home/axura/pwn/kxheap/2.35/ld-2.35.so -Wl,-rpath=/home/axura/pwn/kxheap/2.35 -lc -g
GDB x IDA
Setup
Use an IDA plugin decompdbg, download here, to run GDB with IDA decompiled pseudo codes (but this has some limitation when it comes to complex binaries).
Pull the repo, then copy decompilers/d2d_ida/* under the path IDA/plugins.
git clone https://github.com/mahaloz/decomp2dbg.git

# On Windows or where IDA installed
cp -r ./decompilers/d2d_ida/* /path/to/ida/plugins/Then, in our Linux machine, run:
git clone https://github.com/mahaloz/decomp2dbg.git
cd decomp2dbg

pip3 install . && \
cp d2d.py ~/.d2d.py && echo "source ~/.d2d.py" >> ~/.gdbinitNext, fix Python environment, as Pwndbg use its own Python venv. Run to check
$ python -c "import decomp2dbg; print(decomp2dbg.__file__)"

/home/Axura/pwn/decomp2dbg/decomp2dbg/__init__.pyCopy the site-packages directory path:
/home/Axura/pwn/decomp2dbgAt the very top of the copied file .d2d.py, add:
import sys
sys.path.append('/home/Axura/pwn/decomp2dbg')Make sure this is added before the import decomp2dbg line.
Run
Start server in IDA under edit/plugins/Decomp2DBG:
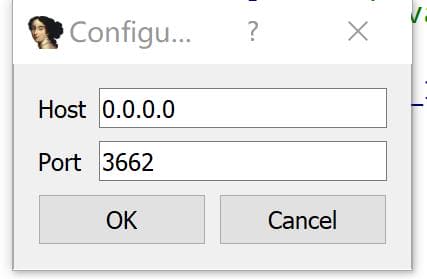
IDA will output:
[+] Starting XMLRPC server: 0.0.0.0:3662
[+] Registered decompilation server!Run GDB on Linux for the same binary, and enter command:
pwndbg> start
pwndbg> decompiler connect ida --host 192.168.xx.xx(LAN IP) --port 3662
[+] Connected to decompiler!Now we can have a new Window in GDB showing the IDA decompiled code:
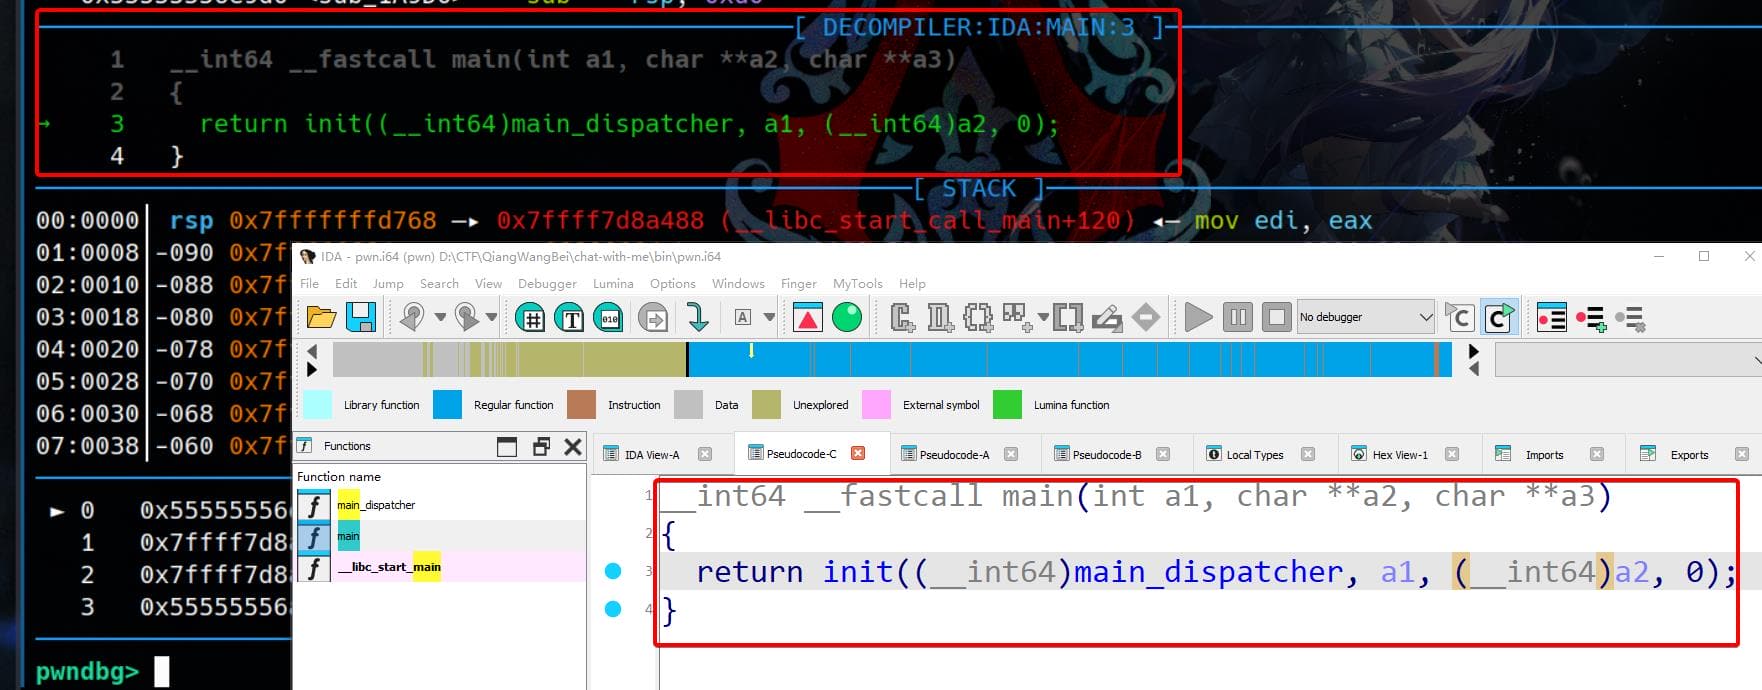
GDB Auto Script
When analyzing a large number of crashing or interesting inputs (e.g., from fuzzing), we can automate GDB to inspect specific runtime conditions using batch mode and a command script.
Script
For example, we can write a simple GDB script (e.g., dump.gdb) to:
- Set a breakpoint at a vulnerable or interesting instruction.
- Run the program with input.
- Dump registers or memory values.
Example: dump.gdb
break *mapperTAMA5RAM+153
run
info registers raxThis sets a breakpoint at offset +0x99 in the mapperTAMA5RAM function and dumps the rax register when hit — commonly used to monitor a write index.
Batch
Launch GDB in batch mode like this:
gdb --batch --command=dump.gdb --args ./target_binary input_file--batch: run non-interactively and exit after script--command=dump.gdb: read commands from file--args: pass binary and arguments normally
This runs the binary under GDB, executes the commands in dump.gdb, prints output, and exits — ideal for scripting.
Bulk
Mass analysis example:
for f in crashes/*; do
cp "$f" /tmp/test_input.gb.gz
gdb --batch --command=dump.gdb --args ./test_program ./test_inputs | tail -1
done- Loops through crashing inputs.
- Feeds each into the binary under GDB.
- Captures specific register state or crash condition.
Templates
Heap Tracing
This heap-trace.gdb script is designed to trace heap operations (malloc, calloc, realloc, free) during the execution of a binary, and log relevant function call arguments and backtraces to a file. It is especially useful when analyzing heap-based vulnerabilities.
# heap-trace.gdb
set pagination off
set logging file heap_trace.log
set logging redirect on
set logging on
printf "=== HEAP TRACE GDB SCRIPT LOADED ===\n"
# Breakpoints
break malloc
break calloc
break realloc
break free
# Use this in commands instead of bt: fix old-version gdb (≤ 10.1) for “ui-out” bug
define btlog
python import gdb, sys; sys.stderr.write(gdb.execute("bt", to_string=True))
end
# ---------- [ malloc ] ----------
commands 1
silent
printf "\n========= [MALLOC] =========\n"
printf ">>> malloc(0x%lx)\n", (unsigned long)$rdi
printf "Request size : %lu\n", (unsigned long)$rdi
btlog
continue
end
# ---------- [ calloc ] ----------
commands 2
silent
printf "\n========= [CALLOC] =========\n"
printf ">>> calloc(%lu, 0x%lx)\n", (unsigned long)$rdi, (unsigned long)$rsi
printf "Count : %lu\n", (unsigned long)$rdi
printf "Size : %lu\n", (unsigned long)$rsi
btlog
continue
end
# ---------- [ realloc ] ----------
commands 3
silent
printf "\n========= [REALLOC] =========\n"
printf ">>> realloc(%p, 0x%lx)\n", (void*)$rdi, (unsigned long)$rsi
printf "Old ptr : %p\n", (void*)$rdi
printf "New size: %lu\n", (unsigned long)$rsi
btlog
continue
end
# ---------- [ free ] ----------
commands 4
silent
printf "\n========= [FREE] =========\n"
printf ">>> free(%p)\n", (void*)$rdi
printf "Freed pointer : %p\n", (void*)$rdi
btlog
continue
end
# ---------- [ signal handling + execution ] ----------
handle SIGABRT print stop
handle SIGSEGV print stop
run
# Crash / final state dump
printf "\n========= [CRASH INFO] =========\n"
bt
info registers
quit
Comments | NOTHING